
How Much Has the U.S.-Iran War Cost?
Updated on | Written by Alec Pow
This article was researched using 18 sources. See our methodology and corrections policy.
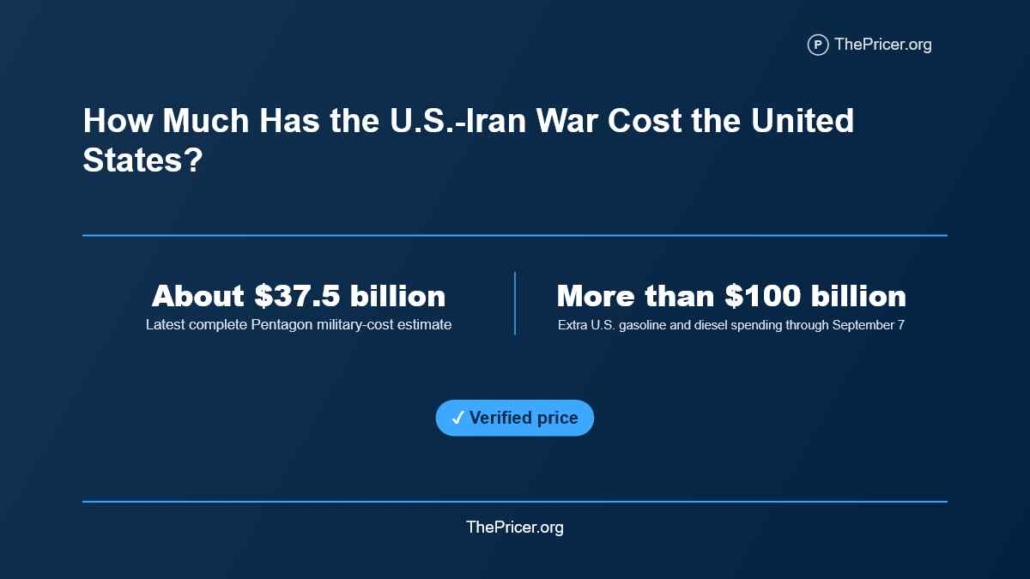
As of September 25, 2026, the newest public federal estimate puts the direct U.S. military cost of the war with Iran at about $38 billion through August 1. The Congressional Budget Office released that estimate on September 15 and said continued operations could add roughly $2 billion to $3 billion per month, depending on the intensity of fighting. Defense Secretary Pete Hegseth’s earlier $37.5 billion Pentagon estimate remains an important government benchmark, but it is no longer the newest cost estimate. The CBO figure also does not represent the full eventual taxpayer bill.
The civilian bill has grown much faster. Brown University reported that extra U.S. gasoline and diesel costs surpassed $100 billion on September 7, equal to more than $750 per U.S. household. That modeled consumer burden alone is now more than 2.6 times the latest CBO military estimate.
Article Highlights
- Latest federal estimate: about $38 billion in direct Defense Department costs through August 1, according to CBO.
- Ongoing military cost: CBO estimates roughly $2 billion per month at lower May-June intensity and about $3 billion per month at July-like intensity.
- Supplemental funding request: the administration requested $87.6 billion in supplemental appropriations in June. CBO says $42.3 billion of that request appears directly related to the Iran conflict.
- Pentagon watchdog accounting: $33.4 billion through June 29, including $22.3 billion in expended munitions and $3.7 billion in equipment losses.
- Fuel burden: Americans had paid more than $100 billion in extra gasoline and diesel costs by September 7, according to Brown University’s modeled no-war comparison.
- Shipping shock: spot container rates from China to the U.S. East Coast reached $10,948 per 40-foot container, more than four times their level when the war began.
- Iran: the IMF’s projection moved from 1.1% growth before the war to a later 5.4% contraction, while Iranian crude loadings also fell sharply.
- True worldwide cost: unknown, because military spending, lost output, household fuel costs, freight costs, corporate losses and reconstruction overlap and use different accounting methods.
How Much Has the U.S.-Iran War Cost the United States?
Jump to sections
The best current direct military estimate is about $38 billion (at $30 per hour, earning that amount would take about 609 thousand years of full-time work, before taxes). The Congressional Budget Office put Department of Defense costs at roughly that level through August 1, replacing the older $37.5 billion Pentagon figure as the newest public federal estimate.
The CBO number is still not a complete war bill. It covers incremental Defense Department operational, logistical and sustainment costs, including replacement of expended munitions and equipment lost in battle, increased flying hours, other operations and higher fuel costs.
CBO also said its estimate carries considerable uncertainty because the Defense Department did not provide all the information the agency requested, forcing analysts to rely on government databases and public reporting. Other federal costs and future expenses can sit outside the $38 billion figure.
There is also an important distinction between estimated costs and requested funding. In June, the administration requested $87.6 billion in supplemental appropriations, including $67.1 billion for the Defense Department. CBO determined that about $42.3 billion of the request appears directly related to the Iran conflict, roughly 10% more than CBO’s $38 billion estimate of Defense Department costs through August 1.
The $42.3 billion should not be added to the $38 billion. One is the portion of a supplemental funding request that CBO identified as directly war-related; the other is CBO’s estimate of costs incurred through its August 1 cutoff.
The earlier Pentagon number remains useful for comparison. Hegseth’s July estimate included bills already incurred plus some military personnel, operations and maintenance costs anticipated through the end of the fiscal year. It excluded the full reconstruction bill for U.S. bases damaged by Iranian attacks.
An independent CSIS cost reconstruction published in June estimated incremental Defense Department costs at roughly $34 billion to $42 billion. Its categories included deployment, munitions, higher operational tempo, equipment losses, damaged bases and higher military fuel costs.
Those estimates cover different cutoff dates and accounting methods. The September CBO report is the strongest current top-line benchmark, but the conflict continued beyond its August 1 cutoff.
Direct answer: The newest federal estimate puts direct U.S. military costs from the Iran war at about $38 billion through August 1. CBO estimates continued operations could add another $2 billion to $3 billion per month at recent levels of fighting, and says monthly costs could climb higher if combat intensifies further. The eventual taxpayer cost can rise once later operations and other costs outside the current estimate are counted.
Iran War Cost Timeline
The figures below use different accounting methods. The early figures show incurred or modeled costs at specific points. The July Pentagon number also included expenses projected through September, while the September CBO estimate uses an August 1 cutoff.
| Date or stage | Estimated cost | Source and meaning |
|---|---|---|
| First six days | At least $11.3 billion (about 181 thousand years of full-time work at $30 per hour) | Pentagon estimate reportedly shared with Congress. |
| First 12 days | Approximately $16.5 billion | CSIS early-war reconstruction. |
| April 29 | $25 billion | Early broad Pentagon estimate. |
| May 12 | $29 billion | Updated Pentagon figure covering operations plus revised repair and replacement estimates. |
| June CSIS model | $34 billion to $42 billion | Incremental DOD cost estimate including base damage and equipment losses. |
| June 29 Pentagon IG accounting | $33.4 billion | Includes $22.3 billion in expended munitions, $3.7 billion in equipment losses and $7.4 billion in other incremental obligations. Infrastructure repairs are excluded. |
| July 21 Pentagon estimate | $37.5 billion | Includes some anticipated costs through September 30, but excludes rebuilding damaged U.S. bases. |
| September 15 CBO estimate | About $38 billion | Estimated Defense Department cost through August 1. CBO estimates another month could cost roughly $2 billion to $3 billion at recent levels of fighting. |
The early-war spending reconstruction shows how front-loaded the campaign was. The first six days cost an estimated $11.3 billion, an average of about $1.88 billion per day. By day 12, the cumulative estimate of $16.5 billion worked out to about $1.38 billion per day.
The later burn rate fell as U.S. forces shifted away from some long-range weapons and Iranian missile and drone launches declined. The new CBO estimate gives a better measure for the later phase. It puts a lower-intensity month near $2 billion and a month resembling July near $3 billion.
What Is Inside the Military Bill?
The Pentagon has not published one public invoice showing every dollar spent across the entire conflict. The September Lead Inspector General report provides the clearest official breakdown for the earlier phase. It says Operation Epic Fury had cost about $33.4 billion as of June 29, before the later July and August fighting covered by the CBO estimate.
Munitions used against Iran
Weapons are the biggest identified military cost. The Pentagon watchdog reported $22.3 billion in expended munitions through late June. The same report said the scale of use had created strategic inventory shortfalls and exposed industrial-base bottlenecks affecting resupply.
That official figure is close to, but lower than, the earlier CSIS model of about $26.1 billion in munitions expenditure and replacement costs. The difference reflects distinct dates and methods rather than two amounts that should be added together.
The price gap between weapons matters. A long-range Tomahawk can cost millions of dollars, while shorter-range guided weapons can sometimes attack suitable targets at substantially lower munition cost. Once Iranian air defenses had been suppressed in some areas, shifting parts of the campaign toward shorter-range weapons helped reduce the strike bill.
Missile and drone defense
The defensive side has become one of the war’s largest hidden military bills. Patriot and THAAD interceptors are consumed when launched and must eventually be replaced.
A CSIS inventory analysis estimated in July that Patriot inventories had fallen below 1,000 interceptors and THAAD inventories to roughly 250. Exact U.S. stockpile numbers are not publicly released, so such inventory estimates should not be confused with official Pentagon counts.
CBO reached the same broader strategic conclusion from a different direction: heavy interceptor use has left the United States with reduced missile-defense inventories that could take years to rebuild.
Public reporting has put individual THAAD interceptors around $15 million. If more than 200 were fired, 200 multiplied by $15 million gives a weapons-value marker of about $3 billion before counting launch equipment, operators, radar, maintenance or the industrial cost of expanding production.
CBO estimates that replenishing some key interceptor inventories could take at least five years. The broader acquisition and battery expenses sit behind the cost of a Patriot missile system. The price mismatch between defensive missiles and cheap incoming drones is also central to drone shootdown costs.
Aircraft and naval operations
The United States has used bombers, fighters, tankers, surveillance aircraft, electronic-warfare aircraft, drones, carriers, destroyers, submarines, amphibious ships and support vessels.
Those forces cost money even when they are not releasing weapons. Flight hours consume fuel and engine life. Ships require fuel, maintenance, stores and crews. Tankers must fly to support long-range sorties. Aircraft can reach scheduled maintenance intervals faster when combat use rises.
Long-range bomber missions carry especially high support needs because of tanker aircraft, bases, crews, maintenance and specialized weapons. The acquisition and operating side of that fleet is detailed in the B-2 Spirit cost analysis.
Damage, losses, and MQ-9 attrition
Equipment losses have become much easier to see than they were in May. The Pentagon Inspector General’s accounting puts equipment losses at about $3.7 billion through June 29. It also reports that Iranian attacks damaged or destroyed hundreds of buildings and structures at U.S. bases across several Middle Eastern countries. Infrastructure repairs are not included in the $33.4 billion watchdog total.
U.S. officials told the Washington Post that at least 45 MQ-9 Reapers had been lost during the Iran war by August 13, roughly one-quarter of the prewar U.S. military fleet. The aircraft were valued at about $30 million to $50 million each depending on sensors and weapons, according to the reported Reaper fleet losses.
ThePricer math gives a range of $1.35 billion to $2.25 billion for 45 configured aircraft. That is 45 multiplied by $30 million at the low end and by $50 million at the high end. It is not a separate bill that can simply be added to Pentagon or CBO totals because equipment losses are already represented in broader war-cost estimates.
Iran’s IRGC then claimed on August 31 that it had shot down another U.S. MQ-9 over the Strait of Hormuz with air-defense missiles. The aircraft reportedly fell into Gulf waters, according to the Iranian MQ-9 shootdown claim. No U.S. confirmation was available for that claim, so this article does not count the aircraft as a confirmed additional loss.
If it is later confirmed and falls outside the earlier 45-aircraft tally, a 46th aircraft at the same reported configured values would lift the scenario range to roughly $1.38 billion to $2.30 billion.
Personnel and logistics

Personnel and logistics costs include deployments, temporary facilities, transportation, medical support, hazardous-duty compensation, ammunition handling, communications, intelligence, security and supply operations.
Another future bill sits outside today’s direct-cost snapshot. CSIS modeled veterans’ disability costs at about $400 million per year under its assumptions, or roughly $12 billion across 30 years. That is a forward-looking scenario rather than a current expenditure, but it illustrates why the fiscal cost of a war can continue long after combat operations decline.
How Large Is Operation Epic Fury?
The scale of the campaign helps explain why the cost climbed so quickly. By April 1, CENTCOM’s April fact sheet reported more than 12,300 targets struck and more than 13,000 combat flights. CENTCOM also said more than 155 Iranian vessels had been damaged or destroyed.
U.S. forces have included bombers, fighters, tankers, surveillance aircraft, MQ-9 drones, Patriot and THAAD batteries, carriers, submarines and surface warships. Targets ranged from command centers and air-defense sites to missile facilities, communications networks, vessels, weapons factories and storage bunkers.
A target count is not a missile count. One sortie can release several weapons, several aircraft can attack the same target, and some missions involve surveillance, refueling, electronic warfare or defensive patrols without releasing a weapon.
What Has the War Cost Iran?
Iran does not publish a single audited war-cost ledger comparable with the U.S. figures, so its burden is better approached through changes in economic projections and oil exports rather than a single dollar total.
Before the war, the IMF’s January 2026 outlook projected 1.1% growth for Iran. The IMF’s later projection for Iran instead shows a 5.4% contraction, a deterioration of 6.5 percentage points from the earlier growth path.
That change should not be converted directly into an audited dollar cost of the war. IMF forecast revisions can also reflect sanctions, inflation, domestic policy, trade conditions, exchange-rate movements and other economic developments.
Oil gives a second lens. Reuters reported that Iranian crude loadings fell from about 2 million barrels per day in March to roughly 220,000 to 255,000 barrels per day in August.
The gap is about 1.745 million to 1.78 million barrels per day, or approximately 52.4 million to 53.4 million barrels over a 30-day month. At an illustrative $100 per barrel, that volume corresponds to roughly $5.2 billion to $5.3 billion in gross cargo value.
Some barrels may be delayed, rerouted or sold later rather than permanently lost, and gross cargo value is not the same as Iranian government revenue. The calculation is useful as a measure of scale, not as a claim that Tehran loses exactly $5.3 billion every month.
Far More Than the Military Bill
The military estimate is only one ledger. Fuel prices, Iranian output losses, freight rates, corporate costs, Israeli spending, damaged infrastructure and slower economic growth sit outside it.
| Cost lens | Current marker | What the figure means |
|---|---|---|
| U.S. military | About $38 billion | CBO estimate of Defense Department costs through August 1 |
| Directly war-related supplemental request | $42.3 billion | Portion of the administration’s $87.6 billion June supplemental request that CBO says appears directly related to the conflict; not a second cost total |
| Extra U.S. gasoline and diesel spending | More than $100 billion | Brown University no-war baseline comparison as of September 7 |
| China-U.S. East Coast container shipping | $10,948 per 40-foot container | Xeneta spot rate reported September 17; more than four times the level at the start of the war |
| Iran oil-loading gap at illustrative $100/barrel | About $5.2 billion to $5.3 billion per month | Gross cargo-value scenario based on March versus August loading volumes, not an audited Iranian revenue loss |
| Israeli budgetary expenses | About $11.5 billion | Preliminary Finance Ministry figure released in April |
| Costs identified by global companies | At least $25 billion | Reuters tally as of May 18, before several more months of disruption |
Do not add these figures together. They measure different things, use different dates, and can overlap. A consumer’s higher gasoline spending can become corporate revenue or costs elsewhere in the economy, while funding requests, GDP forecasts and military expenditures are different accounting concepts.
American drivers have paid more than the military estimate
Brown University’s September energy-cost research brief says extra gasoline and diesel spending surpassed $100 billion on September 7.
The calculation compares actual fuel prices since February 28 with a modeled no-war price path using AAA, EIA, fuel-consumption and Census data. Brown also calculated that the average U.S. household had paid more than $750 extra.
Using only the minimum $100 billion Brown threshold:
$100 billion ÷ $38 billion = about 2.63.
The modeled consumer fuel burden had therefore exceeded 2.6 times the newest direct military-cost estimate by September 7.
This does not mean the war cost is $138 billion. The two numbers measure different things and should not be summed into one total.
CBO provides another way of seeing the household effect. It estimates that in the first quarter of 2027, year-over-year PCE inflation will be about 0.5 percentage point higher than the agency projected before the war, while core PCE inflation will be about 0.3 percentage point higher.
CBO also estimates that higher energy prices attributable to the conflict added about 2.3 percentage points to the annualized rate of overall PCE inflation in the second quarter of 2026.
Those are modeled inflation effects, not another dollar amount to add to the military bill or Brown’s fuel estimate. The household impact of higher gasoline prices is examined separately in our analysis of gas prices after the Iran strikes.
The Hidden Cost: Moving Goods
Fuel is not the only channel carrying the war into household budgets.
The price of moving a container from China to the U.S. East Coast reached $10,948 per 40-foot container in September, according to Xeneta data reported by Reuters. That was more than four times the level when the war began on February 28 and was approaching the pandemic-era record.
Higher bunker-fuel prices are one reason. Shipping companies have also faced longer routes, war-risk exposure and disruption around two of the world’s critical maritime chokepoints: the Strait of Hormuz and the Bab el-Mandeb.
This is where an oil-price shock can become a price increase on something that contains no oil.
A retailer importing furniture, appliances, clothing, electronics or parts has to spread a larger freight bill across the cargo inside the container. Some businesses absorb the increase through lower margins. Others pass part of it through in wholesale or retail prices.
CBO makes essentially the same connection at the macro level: because transportation is embedded in the cost of nearly every physical product, higher petroleum prices can indirectly raise prices well beyond the gas station.
That example is illustrative rather than a claim about any specific shipment, but it shows how a geopolitical disruption thousands of miles away can eventually appear on an American receipt.
Israel’s budget cost
Israel’s Finance Ministry estimated in April that the war had added about 35 billion shekels, then around $11.5 billion, to government expenses.
About 22 billion shekels went to defense and security spending, according to the preliminary Israeli budget assessment. Defense represented about 62.9% of the identified budget cost.
The April figure is not Israel’s full bill through September.
Costs to companies
By May 18, publicly listed companies had identified at least $25 billion in war-related costs.
A Reuters review of 279 companies found businesses raising prices, cutting production, reducing forecasts, adding surcharges, suspending shareholder payments or seeking state support. Airlines accounted for nearly $15 billion of the May tally.
The $25 billion figure predates several additional months of energy and shipping disruption, so it is best read as an early documented floor rather than the current worldwide corporate total.
The 2026 War vs. the 2025 Iran Strike
The June 2025 operation and the 2026 war should not be priced as similar events.
Operation Midnight Hammer was a concentrated attack on three Iranian nuclear facilities. On June 22, 2025, about 125 U.S. aircraft took part in the 2025 strike package. Seven B-2 bombers dropped 14 GBU-57 Massive Ordnance Penetrators, while a guided-missile submarine launched Tomahawks.
Approximately 75 precision-guided weapons were reported across the wider operation, but only 14 were GBU-57 bunker busters.
The 2026 campaign began February 28 and expanded across thousands of targets, missile defense, surveillance, maritime operations, base protection, equipment replacement and months of deployments.
The 30,000-pound weapon used against the buried nuclear facilities is covered in our bunker-buster bomb cost article. A weapon price still does not equal a mission price because escorts, tankers, intelligence aircraft, naval forces, communications, fuel and maintenance remain outside the bomb itself.
The cost distinction is simple: the 2025 operation was a concentrated strike package. The 2026 war has required repeated strike packages plus months of defense, surveillance, logistics, repairs and replenishment.
What the New CBO Rate Implies
CBO estimates that another month of lower-intensity fighting similar to May and June would cost around $2 billion. A month closer to July’s intensity would cost about $3 billion.
Those monthly figures make a six-month scenario more useful than simply extending the exceptionally high spending rate seen during the opening days.
Holding the two CBO monthly rates for six additional months gives:
- $38 billion + 6 × $2 billion = about $50 billion
- $38 billion + 6 × $3 billion = about $56 billion
The $50 billion to $56 billion range is not a CBO forecast of the final war cost. It is a ThePricer scenario showing what the latest CBO monthly rates imply if operations continue for another six months at similar intensity.
CBO also explicitly warns that monthly costs could exceed its $3 billion July-like benchmark if fighting escalates further.
Costs Still Building After Six Months
The June reduction in fighting did not close the ledger. Hostilities subsequently resumed, while U.S. forces remained heavily deployed around the Gulf and Strait of Hormuz.
Several bills can keep growing even during lower-intensity periods:
- Weapon replacement: Tomahawks, Patriot interceptors, THAAD interceptors, bombs and drones need replenishment.
- Base reconstruction: damaged Middle Eastern facilities create repair costs beyond the simplest operating-cost headline.
- Aircraft replacement: the reported MQ-9 losses expose more than a billion dollars of configured-aircraft value.
- Stockpile capacity: the Pentagon watchdog reports strategic munitions shortfalls, while CBO says rebuilding key interceptor inventories could take years.
- Veterans’ costs: medical treatment and disability payments can continue for decades.
- Interest: additional federal borrowing ultimately carries financing costs.
- Freight and logistics: higher fuel prices, war-risk costs and constrained maritime routes can keep feeding through global supply chains even when the direct U.S. strike tempo falls.
The energy side also remains disrupted, even as diplomacy creates the possibility of a reduction in hostilities.
On September 25, oil markets were weighing the possibility of a U.S.-Iran truce. Brent crude traded around $105.73 per barrel early Friday, while West Texas Intermediate was about $93.05. U.S. and Iranian negotiators in New York were exploring a phased path out of the war that could involve Tehran reopening the Strait of Hormuz and Washington lifting its economic blockade.
Shipping through Hormuz remained severely constrained. Preliminary ship-tracking data reported September 25 showed nine commodity vessels crossed the strait on Thursday, down from 14 the previous day and compared with a recent 10-day average of 18. Before the war, the strait typically handled around 125 large commercial vessels per day.
Some ships can travel with their AIS transponders switched off, so those counts do not capture every crossing.
Pressure has also spread toward the Red Sea and Bab el-Mandeb, adding a second major shipping-risk channel. That matters because a conflict can continue generating economic costs through oil, diesel, freight and insurance even during periods when the direct military spending rate slows.
Answers to Common Questions
How much has the U.S.-Iran war cost the United States?
The newest federal estimate is about $38 billion in direct Defense Department costs through August 1, according to the Congressional Budget Office. Later operations mean the running military cost is higher than that cutoff figure.
Is $38 billion the final cost of the war?
No. CBO’s estimate stops at August 1. Operations continued afterward, and future weapon replacement, infrastructure repairs, veterans’ expenses and other costs can increase the eventual fiscal burden.
Why did the administration request more than the $38 billion CBO cost estimate?
The administration requested $87.6 billion in supplemental appropriations in June, including $67.1 billion for the Defense Department. CBO says about $42.3 billion of the request appears directly related to the Iran conflict. A supplemental funding request can include money intended for upcoming needs and therefore should not be treated as a second bill to add to the $38 billion estimate.
How much is the war costing each month?
CBO estimates about $2 billion per month at lower levels of fighting similar to May and June and about $3 billion per month at intensity closer to July. It says the monthly cost could be higher if fighting escalates further.
Have American consumers paid more because of the war?
Brown University estimates that Americans had spent more than $100 billion extra on gasoline and diesel by September 7 compared with its modeled no-war price path, equivalent to more than $750 per household on average.
How is the war affecting shipping costs?
Xeneta data reported in September put the spot rate for a 40-foot container from China to the U.S. East Coast at $10,948, more than four times its level at the beginning of the war. Fuel costs, route disruption and maritime risk can eventually feed into prices for imported goods.
How much has the war cost Iran?
No audited total exists. The IMF’s outlook for Iran moved from 1.1% growth before the war to a later projection of a 5.4% contraction, but that change cannot be assigned entirely to the conflict. Iranian crude loadings also fell from around 2 million barrels per day in March to roughly 220,000 to 255,000 barrels per day in August. At an illustrative $100 per barrel, the missing monthly loading volume has a gross cargo-value scale of about $5.2 billion to $5.3 billion, but that is not the same as lost Iranian government revenue.
How much has the war cost the global economy?
No single defensible audited dollar total exists. The clearest measurable international effects include higher oil and refined-fuel prices, disrupted shipping, higher freight and insurance costs, corporate losses and weaker economic projections in exposed economies. Those effects overlap, so they should not be converted into or added together as one worldwide war bill.
Is the U.S.-Iran war over?
No. As of September 25, 2026, the conflict remains active. U.S. and Iranian negotiators are discussing a possible phased path out of the war, but no final settlement has been reached, and shipping through the Strait of Hormuz remains severely constrained.
The current U.S. military anchor is CBO’s estimate of about $38 billion through August 1, 2026. The Pentagon’s earlier $37.5 billion estimate, Inspector General accounting, independent military models, supplemental funding requests and wider economic-cost figures use different assumptions and dates and should not be added together. ThePricer calculations, including the MQ-9 value range, Iran oil-loading scenario, six-month CBO-rate scenario and container-cost example, are arithmetic based on sourced amounts and are not official government totals. Article status and live market context checked through September 25, 2026.
Disclosure: Educational content, not financial advice. Prices reflect public information as of the dates cited and can change. Confirm current rates, fees, taxes, and terms with official sources before purchasing. See our methodology and corrections policy.