
How Much Does a Car Depreciate Per Year?
Published on | Written by Alec Pow
This article was researched using 13 sources. See our methodology and corrections policy.
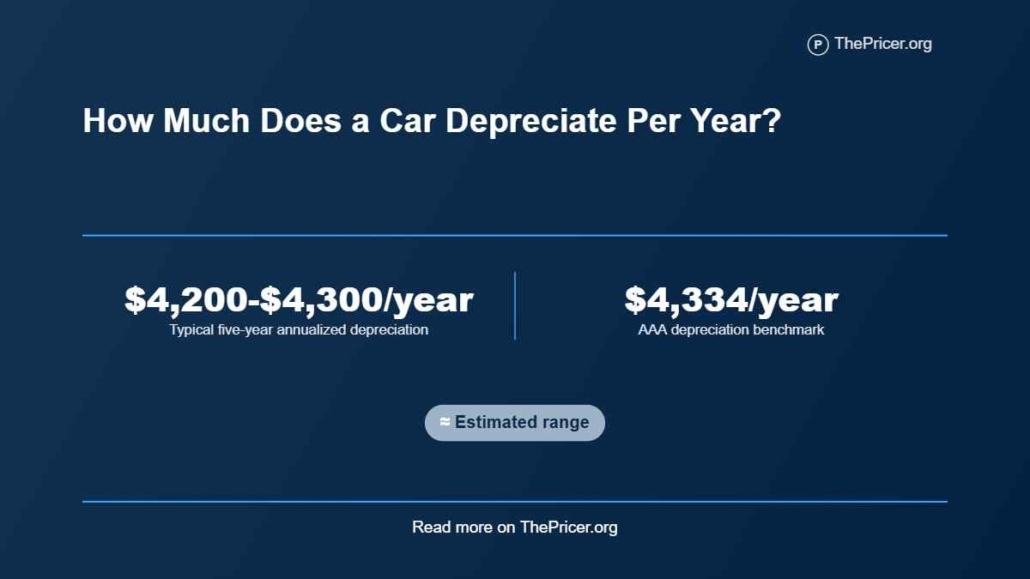
For a new U.S. vehicle, car depreciation typically costs about $4,200 to $4,300 per year when the loss is averaged across the first five years of ownership. AAA’s latest annual driving-cost benchmark is $4,334 per year for a new vehicle owned for five years and driven 15,000 miles annually. That is lost vehicle value rather than a recurring payment, and the owner can lose much more than the five-year average during the first year.
Purchase price, mileage, age, condition, powertrain, incentives, model demand, and the used-car market all influence the result. A driver comparing vehicles should separate the annualized five-year loss from the depreciation that occurs during one specific year, then compare dollar loss rather than relying on a percentage alone.
AAA provides the annual ownership-cost benchmark, iSeeCars contributes observed five-year resale results, Kelley Blue Book publishes forward residual-value projections, and Cox Automotive tracks current new-vehicle and wholesale used-vehicle pricing. CARFAX and Edmunds add year-by-year depreciation models, while the Toyota Tacoma, Tesla Model 3, hybrids, EVs, SUVs, and trucks show how model, body style, and powertrain can change retained value.
Article Highlights
Jump to sections
- AAA’s five-year model averages depreciation at $4,334 (at $30 per hour, earning that amount would take about 3.6 full-time workweeks, before taxes) per year.
- A current-price scenario using a $50,089 new-vehicle transaction price produces about $4,187 per year of five-year depreciation.
- At the same $50,000 starting value, the observed five-year segment gap works out to about $2,180 per year between EVs and hybrids.
- AAA’s mileage adjustments put modeled depreciation near $3,954 per year at 10,000 miles and $4,776 per year at 20,000 miles.
- The first year can be much harsher than the five-year annual average.
How Much Does a Car Depreciate Per Year?
AAA provides a strong national planning benchmark. Its 2025 study says depreciation averaged $4,334 per year. The study covered 45 models across nine vehicle categories and assumed five years of ownership with 15,000 miles driven each year. AAA defined depreciation as the difference between the new-vehicle purchase price and estimated trade-in value at the end of five years. That makes the figure a five-year annualized ownership cost, not a year-one forecast.
AAA also put total annual ownership and operating cost at $11,577 (about 9.6 full-time workweeks at $30 per hour) under the study assumptions. Dividing $4,334 by $11,577 shows that depreciation represented about 37.4% of that modeled annual total. The share is useful because depreciation is easy to miss in a monthly household budget even when it is one of the largest economic costs of owning a newer vehicle.
The benchmark should be treated as a planning center, not a promise. A cheaper sedan can lose fewer dollars even with a mediocre retention rate, while an expensive truck can lose more dollars despite holding a larger percentage of its original value. The owner’s actual purchase price also matters. Paying below MSRP can reduce the dollar base exposed to depreciation, while a large dealer markup or costly option package can raise the amount at risk if the used market does not value those extras equally.
What Depreciation Measures
Depreciation is the drop between what a vehicle is worth when acquired and what it is worth later. For a new-car buyer, the cleanest starting point is usually the actual transaction price rather than the sticker price. The ending point may be a dealer trade-in value, private-party value, or another market measure. Those values can differ, so a calculation should keep the valuation method consistent from start to finish.
Depreciation differs from cash expenses. Fuel, repairs, registration, loan interest, and insurance require payments during ownership. Depreciation sits in the asset itself. A driver feels it when the car is sold, traded, totaled, or compared with an outstanding loan balance. That distinction matters beside expenses such as teenage car insurance costs. Treating depreciation as another monthly invoice can misstate cash flow.
An annual depreciation figure can mean two different things. One method takes a five-year value loss and divides it by five, which is useful for ownership budgeting. Another measures the value change during one specific year. The second method captures the steep early decline and the flatter later years. Those numbers should not be swapped. A five-year average answers how much value the car consumed per year across the holding period. It does not predict the exact loss during the next twelve months.
Why Year One Hurts More
The five-year average hides a steep early drop. CARFAX says its 2026 data show a new vehicle loses about 12.5% in the first year and roughly 5% of value in each of the next four years. Its current guidance also recommends starting with the price actually paid rather than MSRP. Under that curve, a buyer who sells after one year absorbs a much larger annual percentage loss than an owner who spreads the decline across a longer holding period.
Edmunds produces a steeper first-year estimate. Its True Cost to Own data place average first-year depreciation at 23.5% of MSRP and show a model-level span from 6% to 45% after one year. Edmunds bases future resale estimates on auction and retail transactions, supply and demand, new-vehicle pricing and incentives, model changes, competitive segment, and its economic forecast. The gap between CARFAX and Edmunds is a warning against treating one percentage as a universal rule.
The purchase basis also changes the dollar answer. A 12.5% first-year loss on a $30,000 (about 5.8 months of full-time work at $30 per hour) transaction price equals $3,750. The same percentage on a $60,000 purchase equals $7,500. A shopper comparing models should pair the expected retention percentage with the actual negotiated price. Percentage alone can make a high-priced vehicle look economical even when its dollar loss remains large.
Vehicle Type Changes the Loss
Powertrain and body style can create large differences even before individual models are compared. iSeeCars analyzed more than 950,000 five-year-old used vehicles sold from March 2025 through February 2026. Its 2026 depreciation study found a 41.8% five-year loss across the market. Hybrids lost 35.4%, trucks 34.2%, SUVs 44.9%, and EVs 57.2%. Those are observed historical results for vehicles reaching age five, not forecasts for a car bought today.
Putting every segment on the same hypothetical $50,000 purchase price exposes the retention effect without mixing in different average purchase prices. The calculations below multiply $50,000 by each observed five-year depreciation rate, then divide the resulting loss by five. This is a ThePricer scenario, not a claim that buyers in each segment paid the same amount.
| Vehicle segment | Observed five-year loss | Loss on a $50,000 start | Simple annual equivalent |
|---|---|---|---|
| Truck | 34.2% | $17,100 | $3,420 |
| Hybrid | 35.4% | $17,700 | $3,540 |
| SUV | 44.9% | $22,450 | $4,490 |
| EV | 57.2% | $28,600 | $5,720 |
The same-price EV and hybrid cases differ by $10,900 across five years, equal to $2,180 per year on this simple annual basis. Current model forecasts can also diverge. Kelley Blue Book projects the 2026 Toyota Tacoma to retain 63% of MSRP after five years, while the 2026 Tesla Model 3 is projected at 35%. Its 2026 resale-value awards put the new-vehicle average at about 44.7% retained value after 60 months. These are forward projections, so they should stay separate from the iSeeCars observed transaction results.
Mileage and Condition Effects
 Mileage changes depreciation even when the vehicle itself does not change. AAA’s detailed 2025 cost tables show a weighted depreciation adjustment of minus $380 per year at 10,000 annual miles and plus $442 per year at 20,000 annual miles, each measured against the 15,000-mile baseline. Applying those adjustments to the $4,334 baseline gives about $3,954 per year at 10,000 miles and $4,776 per year at 20,000 miles.
The distance between those two cases is $822 per year across 10,000 additional annual miles. Dividing $822 by 10,000 produces about 8.22 cents per added mile within AAA’s five-year model. That figure is a sensitivity result, not a universal mileage penalty. Make, model, age, local demand, and mileage already accumulated can change what another mile does to resale value.
Condition can push the realized loss away from any clean mileage curve. Experian lists age, mileage, condition, and market demand among the variables that shape vehicle value in its May 2026 depreciation review. Accident history, visible wear, mechanical condition, and service documentation can also affect the offer a seller receives. Low-mileage drivers who use a car only occasionally may want to compare ownership with carsharing costs such as Zipcar before accepting years of depreciation for a lightly used asset.
A Current-Price Worked Example
A current-market scenario can translate the percentage data into a dollar budget. Cox Automotive reported that the U.S. average new-vehicle transaction price reached $50,089 in August 2026 in its August transaction-price report. The scenario uses that purchase price and the previously cited iSeeCars observed five-year depreciation rate of 41.8%. It excludes taxes, fees, financing, insurance, fuel, and maintenance.
- Starting transaction price is $50,089.
- Five-year modeled value loss is $50,089 multiplied by 41.8%, which equals about $20,937.
- Modeled value remaining after five years is about $29,152.
- Simple five-year annualized depreciation is $20,937 divided by five, or about $4,187 per year.
- Monthly economic loss on that annualized basis is about $349 per month.
The $4,187 scenario lands only $147 per year below AAA’s separate $4,334 benchmark, a difference of roughly 3.4% measured against AAA. That close result is useful as a cross-check, but the methods are not interchangeable. AAA models selected new vehicles across five years and 75,000 miles. The iSeeCars rate comes from five-year-old vehicles already sold, while the Cox input is a current 2026 transaction price. The calculation is a planning estimate, not a resale forecast for a 2026 model in 2031.
New vs Used Timing
Buying after the steepest early decline can reduce the depreciation a buyer absorbs, but the saving depends on the used purchase price. A one-year-old car that sells close to new-car pricing may offer little depreciation advantage. A used vehicle bought after a large early decline can shift part of the value loss to the prior owner. The negotiated price decides how much of that advantage reaches the next buyer.
Used-car values also move with the market. Cox Automotive’s August 2026 Manheim index showed adjusted wholesale used-vehicle prices 0.4% above August 2025 but 0.9% below July 2026. Market prices move. A fixed depreciation schedule cannot capture that monthly movement.
Holding period matters just as much as purchase age. A buyer who trades every two or three years repeatedly encounters the expensive front portion of the curve. Keeping a reliable vehicle longer spreads the original value loss across more years, although repair and maintenance exposure can rise with age. Drivers comparing a new EV with a longer ownership horizon can also review Rivian R2 purchase costs to keep purchase price, charging, and depreciation as separate budget lines.
When Resale Value Matters Most
Resale value matters most when the holding period is short. A buyer planning to trade in three years can realize a large depreciation loss even if fuel and maintenance spending stays modest. The Consumer Financial Protection Bureau explains that an auto loan above vehicle value means the borrower owes more than the car is worth. A long-term owner may care less about the eventual resale amount.
Paying extra for stronger retention works only when the retained-value advantage can exceed the upfront premium. A high residual percentage does not erase a high purchase price. The timing matters. Compare expected dollar loss across the same ownership period, mileage, and valuation basis.
Makes sense if
- You expect to sell or trade the vehicle within three to five years.
- Two candidate models have similar purchase prices but very different resale histories or projections.
- You drive enough miles that the resale effect can be estimated from realistic mileage rather than a low-mile assumption.
Does not make sense if
- You would pay a large purchase premium solely to obtain a modest retention advantage.
- You plan to keep the vehicle until its resale value is a small part of the ownership decision.
- The comparison mixes an observed used-car result with a forward residual forecast as if both measured the same period.
- Your expected mileage or condition differs sharply from the assumptions behind the quoted value.
Answers to Common Questions
How much does a new car depreciate per year?
A practical five-year planning figure is about $4,200 to $4,300 per year for a new U.S. vehicle, with AAA’s latest annual benchmark at $4,334 per year. The actual first-year loss can be much higher than the five-year annualized figure.
How much value does a car lose in the first year?
Published estimates vary sharply by method and model. CARFAX uses about 12.5% for its 2026 broad estimate, while Edmunds reports a 23.5% average and a model range from 6% to 45% of MSRP after year one.
Does driving fewer miles reduce depreciation?
Yes. AAA’s five-year model lowers annual depreciation by $380 at 10,000 annual miles compared with its 15,000-mile baseline. Its 20,000-mile case adds $442 per year.
Do electric cars depreciate faster?
The 2026 iSeeCars study found five-year EV depreciation of 57.2%, versus 35.4% for hybrids, 34.2% for trucks, and 44.9% for SUVs. Those are observed results for five-year-old vehicles sold during the study period, not a guarantee for a new EV bought now.
Disclosure: Educational content, not financial advice. Prices reflect public information as of the dates cited and can change. Confirm current rates, fees, taxes, and terms with official sources before purchasing. See our methodology and corrections policy.