
How Much Does a Home Theater Cost Per Year to Run?
Published on | Written by Alec Pow
This article was researched using 12 sources. See our methodology and corrections policy.
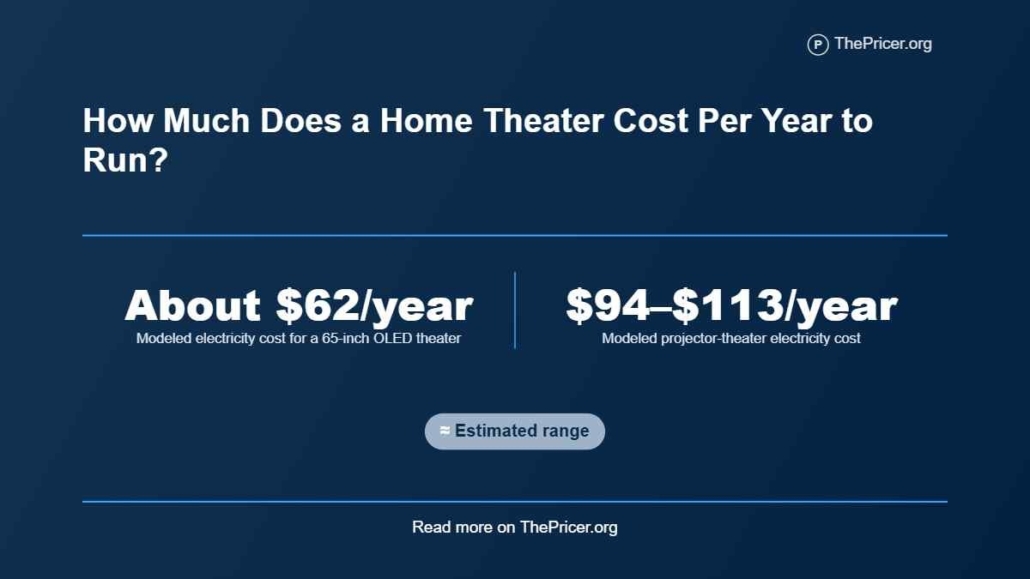
A home theater costs about $62 per year in electricity in the modeled 65-inch OLED TV setup used here. A projector configuration with the same audio and streaming assumptions runs about $94 to $113 per year. Both estimates use three active hours per day and the EIA’s January through June 2026 residential rate of 18.16 cents per kWh. A projector setup used for three hours of PS5 gaming each day reaches about $156 per year under the same audio assumptions.
These are modeled operating costs, not a national household average or a full home-theater ownership budget. The yearly electricity bill changes with the display, source device, receiver and subwoofer load, viewing hours, standby settings, and local utility price. Equipment purchases, installation, streaming subscriptions, room treatment, repairs, and projector lamp replacement remain outside the electricity total.
The equipment model uses a Samsung S95F 65-inch OLED TV or Epson Home Cinema 3800 projector, a Denon AVR-X1800H receiver standby reference, an SVS SB-1000 Pro subwoofer standby reference, an Apple TV 4K streaming source, and a PlayStation 5 gaming comparison. These named components keep the calculations tied to identifiable products rather than a generic wattage estimate while the active receiver and subwoofer loads remain labeled assumptions.
Article Highlights
Jump to sections
- A TV-based theater modeled at three hours per day uses about 339 kWh yearly and costs about $62 (at $30 per hour, earning that amount would take about 2.1 hours of work, before taxes) per year.
- An Epson Home Cinema 3800 moves the same modeled system to about $94 per year in ECO mode or $113 per year in High mode.
- Two three-hour movie nights each week cut the TV-based scenario to about $19 per year.
- The same 339 kWh annual use costs about $44 at Nevada’s June 2026 residential price and about $179 at Hawaii’s.
- Modern low-power standby can be small, but console rest settings can still move the annual bill by several dollars.
What Counts as Running Cost?
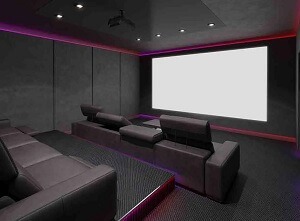
For a useful yearly estimate, running cost should mean the electricity consumed by the equipment while the theater is active and while connected devices wait in standby. A common dedicated setup includes a TV or projector, an AV receiver, a powered subwoofer, and a streaming box or console. Passive speakers do not draw wall power on their own because the receiver supplies their amplifier power. The model here uses one display, one receiver, one powered subwoofer, and one source device.
That boundary matters because a home theater has several other expenses that do not belong in the electric bill. The purchase price of a flat-screen TV, projector hardware, seating, cables, mounts, and professional setup are acquisition costs.
Home theater soundproofing costs belong to the room build. A failed panel may create a separate TV screen replacement expense. Streaming subscriptions are recurring ownership costs, but they do not change the wattage calculation.
A projector lamp or laser light source also belongs outside the electricity estimate. Lamp replacement can be real ownership spending, yet mixing it into a power figure would make a TV and projector comparison harder to read. The annual figures below answer one question only, how much electricity the theater equipment uses at a defined schedule and rate.
Annual Electricity by Setup
The national calculation uses the cited 18.16 cents per kWh rate, which EIA marks as preliminary 2026 data. The TV case uses Samsung’s U.S. S95F specification, where the 65-inch model’s 146W typical rating is paired with 0.5W standby. The projector cases use the Home Cinema 3800’s 309W ECO and 406W High ratings. Keeping the audio and source assumptions fixed makes the display difference visible without mixing unrelated hardware changes.
Audio is the less certain part. The worked model assigns 100W of active draw to the receiver and 50W to the powered subwoofer. Those are explicit planning assumptions, not manufacturer averages. Apple’s U.S. testing lists the Apple TV 4K at 2.31W for 4K HDR streaming and 0.49W network standby. Sony’s February 2026 European-SKU tests place current PS5 models near 217W for UHD gaming, with 0.30W low-power rest and 4.71W when all listed rest features are active. The Sony figures serve only as an equipment power benchmark. A 50W change in the combined active audio assumption changes the three-hour-daily annual bill by about $10 (about 20 minutes at $30 per hour) at the cited rate. Every row uses three active hours per day and 21 hours in standby unless stated otherwise.
| Modeled setup | Active system draw | Annual electricity | Annual cost |
|---|---|---|---|
| 65-inch OLED plus Apple TV | 298.31W | 338.8 kWh | $62 |
| Epson 3800 ECO plus Apple TV | 461.31W | 517.3 kWh | $94 |
| Epson 3800 High plus Apple TV | 558.31W | 623.5 kWh | $113 |
| Epson 3800 High plus PS5 gaming | 773.19W | 857.4 kWh | $156 |
Power Draw by Component
Display power is straightforward when a manufacturer publishes a typical or operating figure. Samsung lists 146W typical for the 65-inch S95F, while Epson lists three operating modes for the Home Cinema 3800. The source device can be much smaller. Apple’s testing used above shows the streaming box drawing only a few watts while active and less than a watt in network standby. That small source load is why the display and audio chain dominate the movie-only model.
Receiver and subwoofer labels need more care. Denon lists 430W as the AVR-X1800H power-consumption specification, but the manual gives standby ratings of 0.1W and 0.5W for normal and CEC standby. A 430W specification should not be treated as a promise that the receiver pulls 430W through every movie. Actual demand changes with channel count, speaker load, volume, content, and amplifier behavior.
The same warning applies to a powered subwoofer. SVS rates the SB-1000 Pro amplifier at 325W RMS, yet the product specifications also list 0.5W low standby consumption. Amplifier capability is not a continuous wall-power measurement during a film. The model uses 50W active for the subwoofer so the assumption stays visible rather than converting an amplifier rating into a false playback average.
TV vs Projector Cost
Switching only the display makes the annual difference easy to isolate. The 309W Epson ECO figure is 163W above the 146W Samsung TV benchmark. Across 1,095 active hours per year, that difference equals 178.5 kWh. At 18.16 cents per kWh, the projector adds about $32 (about 1.1 hours of work at $30 per hour) per year before any change to the receiver, subwoofer, or streaming box.
High projector power widens the gap. The 406W Epson figure is 260W above the TV benchmark, equal to another 284.7 kWh across the same annual viewing time. That adds about $52 per year. The complete system totals move from about $62 for the TV configuration to about $113 for the projector on High. This is a marginal electricity comparison, not a claim that one display has better value or image quality.
Usage can matter more. A household using the modeled TV system for two three-hour movie nights each week lands near 106.5 kWh per year after standby, or about $19 annually. Daily use produces the much larger 338.8 kWh figure. For a theater that sits unused most weekdays, purchase price and room construction can dwarf the electric bill. Heavy daily use gives display efficiency much more financial weight.
Standby Power Adds Up
Low standby specifications keep idle cost small in the core movie model. The Samsung TV contributes 0.5W, the Denon receiver 0.1W, the SVS subwoofer 0.5W, and the Apple TV 0.49W. Together they total 1.59W. If those devices spend 21 hours a day in those states, standby uses about 12.2 kWh per year and costs roughly $2.20 at the national YTD electricity price. That remains modest.
A console can change that picture because rest features use different amounts of power. Using Sony’s cited 0.30W low-power rest and 4.71W all-features rest measurements, the gap is 4.41W. Holding that difference for 21 hours a day equals about 33.8 kWh a year, or about $6.10 at 18.16 cents per kWh.
The practical lesson is measured rather than dramatic. Cutting a 0.5W standby load will barely move a yearly bill. Disabling an idle feature that keeps a device several watts above its lowest rest state has a larger effect. A plug-in power meter can settle the question for an actual rack because network control, HDMI behavior, firmware, and auto-standby choices vary by device.
Your Electricity Rate Matters
 The national rate is a useful benchmark, but it is not the price every household pays. EIA’s June 2026 residential state rates list 13.11 cents per kWh in Nevada, 34.74 cents per kWh in California, and 52.72 cents per kWh in Hawaii. EIA identifies these as preliminary statewide averages, so a household tariff can differ.
Apply those June state figures to the 338.8 kWh TV-theater scenario and location becomes a major price driver. The same equipment and schedule work out to about $44 per year at Nevada’s figure, $118 per year at California’s, and $179 per year at Hawaii’s. The Hawaii result is roughly four times the Nevada result with no hardware change.
For a personal estimate, replace the national benchmark with the effective electricity price on the household bill. Multiply annual theater kWh by dollars per kWh. Time-of-use plans can need a finer calculation if most movies and gaming sessions happen during expensive evening periods. The state comparison above uses one statewide monthly price snapshot to show sensitivity, not a promise about any customer’s tariff.
Three Realistic Use Cases
Case one, occasional movie room. Two three-hour sessions per week with the modeled 65-inch TV system produce about 106.5 kWh a year, including low standby for the remaining hours. At the national YTD rate, the electricity total is about $19 per year. That schedule makes electric cost a small part of theater ownership.
Case two, daily streaming theater. Three hours per day raises the same TV system to 338.8 kWh and about $62 per year. The itemized ThePricer scenario assigns rounded component contributions of about $30 to the Samsung display, $20 to the 100W receiver assumption, $11 to the 50W powered-subwoofer assumption, and $1 to Apple TV active plus standby use. The four parts total about $62. The audio figures remain assumptions because real listening load varies.
Case three, daily projector gaming. The projector runs at 406W and the source changes to a current PS5 gaming benchmark near 217W. The calculation reuses the cited European-SKU benchmark near 217W. With the same 100W receiver and 50W subwoofer assumptions, the modeled annual total is about 857.4 kWh and $156. This scenario measures a different activity, not a like-for-like streaming substitute.
Where Lower Power Pays
A lower-power display has the largest modeled effect for people who use the room many hours each week. Moving from the 406W projector mode to the 309W mode cuts 97W while the image is on. At three hours per day and the national YTD rate, that difference is about $19 per year. Switching from the projector’s High mode to the 146W TV benchmark changes the modeled bill by about $52 per year.
Smaller standby changes deserve proportionate attention. The core four-device standby bundle costs only about $2.20 per year in the stated model. Chasing fractions of a watt with extra hardware may cost more than the electricity it saves. A power meter is most useful when it reveals a device that stays at several watts or more for long idle periods, especially a console, networked receiver, or older powered subwoofer.
Makes sense if
- You use the theater daily and can select a lower projector power mode you already like.
- Your local electricity price is well above the national benchmark.
- A console or networked component remains several watts above its lowest rest state.
- You want measured rack data before replacing working equipment.
Does not make sense if
- You use the room only a few hours each week.
- The proposed change saves fractions of a watt but requires paid hardware.
- You would replace a functioning display solely to chase a small annual electricity difference.
- The power setting would reduce the viewing experience enough that you would reverse it.
Answers to Common Questions
How much does a home theater cost per hour to run?
The modeled 65-inch TV system uses about 0.298 kWh while active, equal to roughly 5.4 cents per hour at 18.16 cents per kWh. The Epson projector model runs about 8.4 to 10.1 cents per active hour before standby.
Does a projector use more electricity than a TV?
In the matched equipment used here, yes. The 309W to 406W projector benchmark draws 163W to 260W more than the 146W TV benchmark while active. That produces about $32 to $52 more yearly at three hours per day.
Does an AV receiver use much electricity on standby?
It depends on the receiver and settings. The Denon benchmark used here lists 0.1W normal standby and 0.5W CEC standby. Active playback can be far higher, which is why standby and listening use should be calculated separately.
How do I calculate my own yearly theater cost?
Multiply each device’s active watts by annual active hours, add standby watts multiplied by annual standby hours, divide by 1,000 for kWh, then multiply by your electricity price per kWh. A wall power meter can replace assumptions with measurements from your own system.
Disclosure: Educational content, not financial advice. Prices reflect public information as of the dates cited and can change. Confirm current rates, fees, taxes, and terms with official sources before purchasing. See our methodology and corrections policy.