
How Much Does It Cost to Own a Car Per Year in the U.S.?
Published on | Written by Alec Pow
This article was researched using 14 sources. See our methodology and corrections policy.
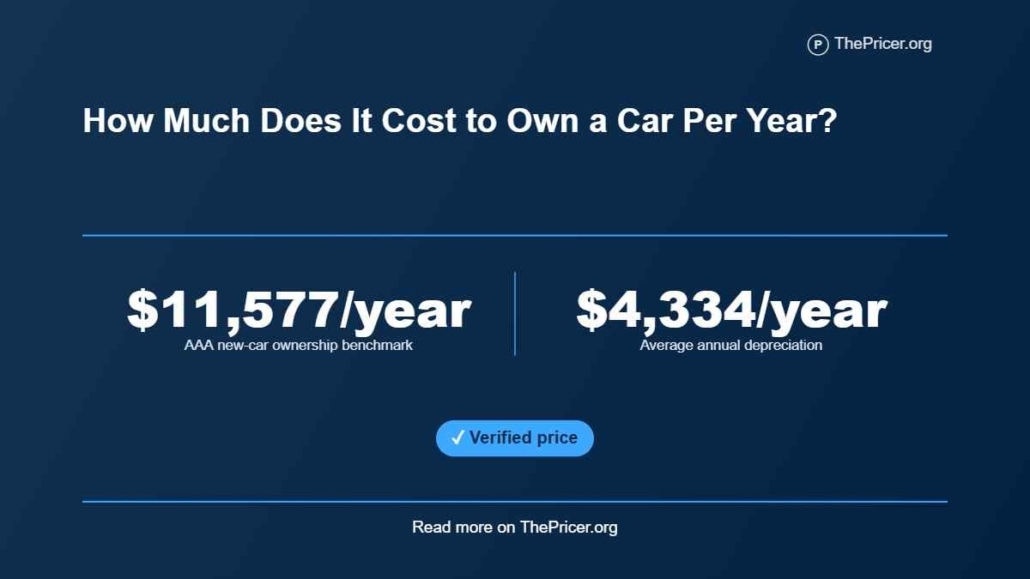
Owning a car in the United States costs about $11,577 per year, or $964.78 per month, for a new vehicle driven 15,000 miles annually under AAA’s 2025 Your Driving Costs model. The estimate covers depreciation, financing, insurance, license and registration costs, taxes, fuel, maintenance, repairs, and tires. AAA published the benchmark in September 2025 after a 45-model ownership analysis spanning nine vehicle categories.
Annual car ownership cost changes with vehicle age, purchase price, body style, annual mileage, fuel economy, insurance profile, loan APR, registration charges, taxes, maintenance needs, and local fuel prices. A new sedan, used SUV, paid-off pickup, hybrid, and electric vehicle can produce very different yearly totals even when their owners drive the same distance. Parking and tolls can raise the household budget further when they apply.
The $11,577 figure is a 2025 benchmark, not a measured 2026 national average. Fuel, insurance, financing, vehicle choice, and mileage can push a household above or below it. A paid-off used car can cost far less than a newly financed vehicle even when repair spending rises.
Article Highlights
Jump to sections
- AAA’s latest full new-car benchmark is $11,577 (at $30 per hour, earning that amount would take about 9.6 full-time workweeks, before taxes) per year at 15,000 miles.
- Depreciation is the largest modeled cost at about $4,334 per year.
- A new-car loan averaged $765 per month in Q2 2026, versus $542 per month for a used-car loan.
- AAA’s small sedan averaged 55.87 cents per mile, while a half-ton pickup averaged 98.54 cents per mile.
- Driving less cuts fuel and wear, but many ownership costs remain even when the car barely moves.
How Much Does It Cost to Own a Car Per Year in the U.S.?
AAA’s June 2026 Car Guide release still cited the 2025 figure of $11,577 (about 9.6 full-time workweeks at $30 per hour) per year, rounded there to $965 per month, and warned that the amount could be higher in 2026 for gasoline vehicles if higher pump prices persisted. The published figure remains a 2025 benchmark rather than a measured full-year 2026 national average.
Other ownership tools use different vehicle sets and assumptions. Kelley Blue Book currently shows a five-year cost of $80,238 across new vehicles for which it can estimate ownership cost, including a first-year figure of $26,560 and a fifth-year figure of $10,831. Its calculation also includes depreciation, insurance, fuel, financing, state fees, maintenance, and repairs. Dividing $80,238 by five gives about $16,048 per year, but that simple average is not interchangeable with AAA’s 15,000-mile study because the underlying vehicle mix and modeling differ.
The useful budgeting rule is to treat national figures as reference points. Your actual total depends on the car, how long you keep it, how much you drive, how you finance it, and where you live.
What Counts as Car Ownership Cost
Total car ownership cost is broader than the monthly payment. A useful economic measure combines loss in vehicle value, loan interest, insurance, taxes and registration, fuel, scheduled service, repairs, and tires. Parking and tolls belong in a personal budget when the owner actually pays them, even though national studies may leave them outside the core model. Depreciation deserves separate treatment because the vehicle is an asset whose value falls over time.
A loan payment is different from an ownership-cost line. Part of each payment repays principal, which converts cash into equity in the vehicle rather than becoming a separate expense on top of depreciation. Edmunds lists financing costs as interest within its ownership method and separately includes depreciation, taxes, fuel, maintenance, repairs, and insurance. Adding the entire annual loan payment to depreciation would count part of the vehicle purchase twice.
That distinction matters. A household cash-flow worksheet can still show the full monthly loan payment because the money leaves the checking account. An economic ownership calculation should show depreciation plus interest instead. Keeping those two views separate explains why a car can feel expensive each month while its accounting-style annual ownership cost uses a different set of lines.
The Six Cost Buckets
AAA’s 2025 fact sheet gives six cost components for its 15,000-mile new-car model and also lists $1.00 per mile at 10,000 miles, 77 cents per mile at 15,000 miles, and 66 cents per mile at 20,000 miles. Its vehicle table puts a small sedan at 55.87 cents per mile and a half-ton pickup at 98.54 cents per mile. The table below converts AAA’s two variable cost lines into annual dollars at 15,000 miles.
| Cost bucket | Published rate | Annual amount at 15,000 miles |
|---|---|---|
| Depreciation | $4,334 (about 3.6 full-time workweeks at $30 per hour) per year | $4,334 |
| Finance | $1,131 per year | $1,131 |
| Insurance | $1,694 per year | $1,694 |
| License, registration, and taxes | $813 per year | $813 |
| Fuel | 13.00 cents per mile | $1,950 |
| Maintenance, repair, and tires | 11.04 cents per mile | $1,656 |
The rounded components total $11,578, one dollar above AAA’s published $11,577 headline. That small difference comes from rounded component figures rather than a separate fee. Insurance also shows why one national model cannot predict one household. Forbes Advisor’s 2026 analysis places average full coverage at $2,434 per year for its modeled driver profile, above AAA’s study figure, and shows much higher costs after some driving-record or credit changes.
Maintenance is another broad bucket. Oil service, tire replacement, scheduled fluids, wear items, and unexpected repairs arrive at different times, so a smooth annual allowance can hide a lumpy real-world bill.
New, Used, or Paid Off
 Financing can make a cheaper used vehicle less cheap on a monthly basis than the sticker-price gap suggests. Experian’s Q2 2026 loan averages put a new-car loan at $43,610, 6.35 percent APR, and $765 per month. The used-car averages were $27,852, 11.19 percent APR, and $542 per month. The same dataset gives average terms of 69.5 months for new loans and 67.9 months for used loans.
ThePricer calculation shows the financing tradeoff in one comparison. Used buyers in that dataset borrowed 36.1 percent less principal, but their average payment was only 29.2 percent lower. The used APR was 76.2 percent higher, while the term was only about 2.3 percent shorter. Lower principal still helps, but the higher borrowing rate absorbs part of the payment advantage. Those figures describe financed buyers in Experian’s dataset, not every new or used purchase.
The purchase market also sets the scale of the asset being financed. Kelley Blue Book data published by Cox Automotive put the August average new-vehicle transaction price at $50,089 in 2026. A paid-off car removes the loan payment and future interest, but it does not erase depreciation, insurance, taxes, fuel, maintenance, tires, or repairs. An older car can trade a smaller depreciation bill for a less predictable repair schedule.
How Mileage Changes the Total
Mileage changes only part of the bill. The AAA mileage figures cited above fall from $1.00 per mile at 10,000 miles to 77 cents per mile at 15,000 miles and 66 cents per mile at 20,000 miles because fixed ownership costs are spread across more driving.
Using those rounded AAA mileage figures gives a useful sensitivity check. At 10,000 miles, the rounded model is about $10,000 per year. AAA’s published 15,000-mile total is $11,577. Cutting annual driving by one-third, from 15,000 to 10,000 miles, trims the modeled annual total by only about $1,577, or 13.6 percent. That is far less than the 33.3 percent mileage reduction because fixed ownership costs stay in place.
The same pattern works in the other direction. A driver at 20,000 miles using AAA’s rounded per-mile figure lands near $13,200 per year. That is about $1,623 above the 15,000-mile benchmark even though mileage rises by one-third. These are planning calculations from rounded AAA figures, not fresh national averages. They show why driving less helps but cannot remove depreciation, insurance, and registration costs from a car that remains owned.
Vehicle Type and Location
Vehicle choice can shift the total before local prices enter the equation. Using AAA’s cited rates of 55.87 cents per mile for a small sedan and 98.54 cents per mile for a half-ton pickup, 15,000 miles implies about $8,381 a year for the sedan and $14,781 for the pickup. The gap is roughly $6,400 per year across multiple cost categories.
Fuel geography adds another layer. For the week of September 7, 2026, EIA reported U.S. regular gasoline at $4.157 per gallon, with the Gulf Coast at $3.685 and the West Coast at $5.362. The West Coast figure was about 45.5 percent above the Gulf Coast figure for that week. A driver with the same vehicle and mileage can face a different fuel budget solely from regional pump prices.
Recurring nonpurchase costs also vary sharply by state. Bankrate’s 2025 study of gas-powered cars estimated recurring costs nationally at $6,894 per year for insurance, taxes, gas, maintenance, and repairs, excluding loan debt. Its state estimates ranged from $4,472 per year in New Hampshire to $8,483 per year in Florida under that methodology. Those numbers use a different model from AAA, so they belong beside the AAA benchmark as location evidence rather than inside the AAA total.
Calculate Your Own Annual Cost
A personal annual total should use the costs that apply to your car. Add insurance, registration and vehicle taxes, expected fuel or charging, planned maintenance, a repair reserve, tire wear, and recurring parking or tolls. For a financed car, keep cash flow separate from economic ownership cost so principal is not added on top of depreciation.
A coherent AAA-style worked total uses the published annual amounts and 15,000-mile rates from the table above. Depreciation of $4,334 plus finance cost of $1,131 plus insurance of $1,694 plus license, registration, and taxes of $813 plus fuel of $1,950 plus maintenance, repair, and tires of $1,656 produces $11,578 from the rounded inputs. AAA’s unrounded model publishes $11,577.
Routine service quotes can refine the maintenance line. Current ThePricer research puts a public full-synthetic visit near $60 at the low end of checked chain offers in its synthetic oil change costs coverage. Current Walmart oil change pricing spans $28.88 to $64.88 for many gasoline vehicles before extra oil or special parts. Budget tires separately by size, type, expected life, and installation using the new tire cost guide.
Do not force every year to look smooth. A year with four routine services and no major repair can be cheap, while the next year may bring tires, brakes, a battery, or suspension work. The annual ownership number works best as a planning average paired with a cash reserve for uneven bills.
When Car Ownership Pays Off
Car ownership makes a stronger financial case when frequent useful trips justify the fixed layer and the vehicle class matches the work it does. A small sedan can carry a much lower modeled annual burden than a half-ton pickup, while a paid-off vehicle avoids new borrowing costs. Keeping a reliable car longer can spread acquisition cost across more years, though repair risk rises with age.
Low annual mileage can weaken the case because insurance, registration, depreciation, and other fixed costs continue while the car sits. A larger vehicle bought for rare needs also carries its higher ownership burden on routine trips. Compare annual ownership cost with the realistic cost and convenience of transit, rideshare, rental, car sharing, or a smaller vehicle serving the same travel pattern.
Makes sense if
- You drive enough that fixed ownership costs are spread across frequent useful trips.
- You expect to keep the vehicle long enough to move past the steepest early depreciation period.
- The vehicle’s size and capability match recurring passenger, cargo, towing, or weather needs.
- You can fund maintenance and repairs without relying on new debt each time a wear item fails.
Does not make sense if
- You drive very little and can meet most trips through lower-cost transport choices.
- You are choosing a high-cost vehicle class for needs that occur only a few times each year.
- The monthly payment fits only after a very long term that raises lifetime interest.
- Insurance, parking, and local taxes make the fixed annual layer too large for your usage.
Answers to Common Questions
How much should I budget each month for a car?
AAA’s latest full new-car benchmark converts to about $964.78 per month at 15,000 miles a year. Your cash budget may differ because the full loan payment is a cash-flow item, while the AAA economic model uses finance cost and depreciation.
Does a paid-off car still have an annual ownership cost?
Yes. A paid-off car still loses value and still needs insurance, registration, fuel or charging, maintenance, tires, and repairs. What disappears is the loan payment and future loan interest.
Can driving less cut my car cost in half?
Usually not within a new-car ownership model. AAA’s rounded mileage figures show that reducing annual driving from 15,000 to 10,000 miles cuts the modeled annual total by about 13.6 percent because many fixed costs remain.
Is a used car always cheaper to own?
No. A used car often starts with a lower purchase price and smaller loan, but higher used-car APRs and repair risk can narrow the gap. Compare purchase price, financing, insurance, depreciation, and expected repairs for the exact vehicles.
Disclosure: Educational content, not financial advice. Prices reflect public information as of the dates cited and can change. Confirm current rates, fees, taxes, and terms with official sources before purchasing. See our methodology and corrections policy.