
How Much Does the U.S. Government Spend on Benefits for Immigrants?
Published on | Written by Alec Pow
This article was researched using 9 sources. See our methodology and corrections policy.
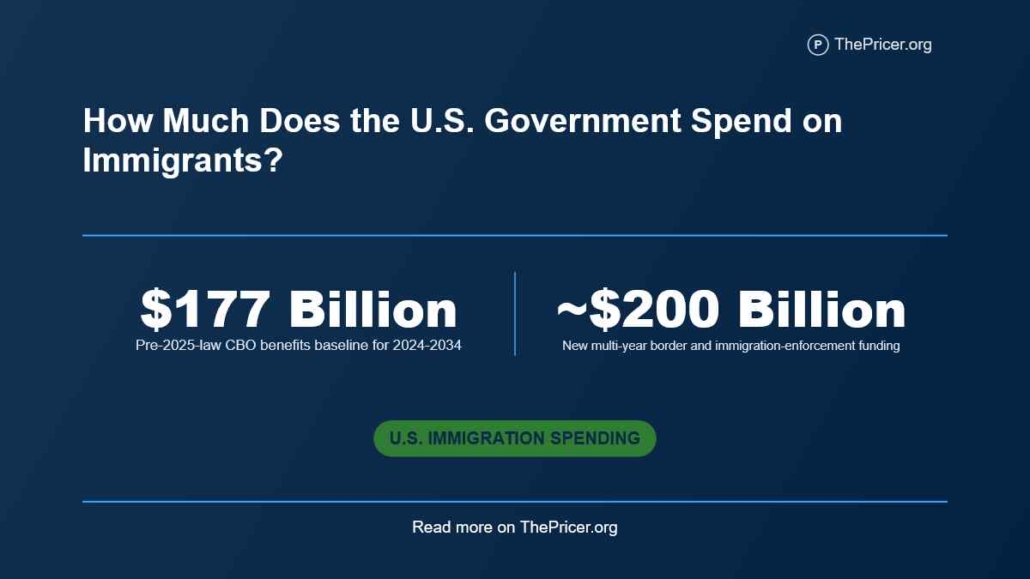
The closest widely cited figure is $177 billion, but even that number needs a large warning label: it was a Congressional Budget Office projection covering 2024 through 2034 for a specific recent immigration-surge population and their U.S.-born children, and it was calculated before Congress changed several major benefit rules in 2025.
The more revealing story is what sits behind that number. In CBO’s old baseline, immigrants in the surge population were projected to pay $788 billion in federal income and payroll taxes over the same period. State and local governments, however, experienced a different fiscal result: CBO estimates that the surge added $19.3 billion in direct costs but $10.1 billion in direct revenue in 2023, leaving a $9.2 billion direct net cost.
Washington’s spending priorities have also changed. The 2025 reconciliation law narrowed eligibility for Medicaid, SNAP, Affordable Care Act premium subsidies, and other programs while providing approximately $200 billion in additional multi-year funding for border security and immigration enforcement. Meanwhile, a new 2026 public-charge rule could reduce federal benefit transfers by an estimated $7.71 billion per year if DHS’s assumed enrollment response occurs.
So the answer is not “$177 billion,” “$37 billion,” “$200 billion,” or any other single figure. Those numbers measure different things. The useful question is where the money actually goes, who receives it, who pays taxes back into the system, and how those numbers have changed under current law.
Last updated: September 30, 2026.
Article Highlights
Jump to sections
- CBO’s July 2024 baseline projected $177 billion (at $30 per hour, earning that amount would take about 2.8 million years of full-time work, before taxes) in additional mandatory federal benefits over 2024-2034 for its defined immigration-surge population and their U.S.-born children.
- That figure is now a historical baseline rather than a current-law forecast because major benefit-eligibility rules changed after the study was published.
- The biggest parts of the $177 billion were approximately $59 billion in ACA premium-tax-credit outlays, about $43 billion in other refundable tax credits, and roughly $40 billion for Medicaid and CHIP.
- The same CBO baseline projected $788 billion in direct federal income and payroll taxes from immigrants in the surge population.
- CBO estimates that the 2025 reconciliation law provided roughly $200 billion for border security and immigration enforcement while restricting access to several federal benefits.
- State and local governments experienced a different result: CBO estimates a $9.2 billion direct net cost in 2023.
- DHS estimates its 2026 public-charge rule could reduce federal benefit transfers by approximately $7.71 billion per year, but that is a modeled behavioral effect, not money already saved.
What Are We Counting?
The first problem with the question is the word “spend.”
Federal money connected to immigration can pay for a child’s Medicaid coverage, an ACA insurance subsidy, a Border Patrol agent, an immigration judge, an ICE detention bed, a refugee-resettlement grant, or an English-language program at a school. Those are all government expenditures connected in some way to immigration, but they are not economically or politically interchangeable.
| Measure | Amount | Period | What it means |
|---|---|---|---|
| CBO mandatory-benefit baseline | $177B (about 2.8 million years of full-time work at $30 per hour) | 2024-2034 | Projection for the defined surge population and U.S.-born children under the pre-2025 baseline |
| Immigration-specific federal accounts | $37B | FY2024 | CBP, ICE, refugee programs, immigration courts and related discretionary funding |
| New border/enforcement funding | ~$200B | Multi-year | Additional current-law funding from the 2025 reconciliation act |
| State/local direct spending | $19.3B | 2023 | Estimated additional direct costs associated with the surge |
| September rescission proposal | $810M | One time | Proposed cancellation of budget authority across 11 accounts |
Those figures should not be added into one giant “immigration cost.” The periods, populations, budget accounts, and legal definitions do not match.
The $177 Billion Baseline
The number readers are most likely to encounter comes from the Congressional Budget Office’s 2024 analysis of the recent immigration surge.
CBO did not attempt to price every immigrant living in America. It modeled the effect of net immigration in its “other foreign national” category exceeding a counterfactual level of 200,000 people per year. Under the agency’s 2024 assumptions, the cumulative difference reached approximately 8.7 million people over 2021-2026.
CBO then estimated the federal budget effect of that additional population and its U.S.-born children.
The headline result was $177 billion (about 2.8 million years of full-time work at $30 per hour) in additional mandatory benefit spending over 2024-2034.
Spread mechanically across 11 years, that is:
$177 billion ÷ 11 = about $16.1 billion per year.
But even that calculation can be misleading if stripped of context. The $177 billion was never an annual invoice, never represented every immigrant in America, and never represented undocumented immigrants alone.
What $177 Billion Really Bought
The composition is more interesting than the headline total.
The largest projected expense was not SNAP and was not traditional cash welfare. It was federal support for private health-insurance coverage.
| Major category | Old CBO 2024-2034 estimate |
|---|---|
| ACA premium tax-credit outlays | ~$59B |
| Other refundable tax credits | ~$43B |
| Medicaid and CHIP | ~$40B |
| SNAP | ~$15B |
| Other programs | Remainder |
ACA subsidies and other refundable tax credits alone account for approximately:
$59 billion + $43 billion = $102 billion.
That is about 58% of the entire $177 billion projection.
This changes the picture considerably. A description such as “$177 billion in immigrant welfare” would obscure the fact that much of the projection was health-insurance assistance and refundable tax credits, and that some spending was for U.S.-born citizen children.
Medicaid and CHIP represented about $40 billion over the period. SNAP added roughly $15 billion. Child nutrition, SSI, Medicare, Social Security, and higher-education assistance made up smaller portions.
For perspective on SNAP itself, see our separate breakdown of how much SNAP costs the U.S. government.
Then the Rules Changed
The biggest problem with quoting $177 billion today is not that CBO calculated it incorrectly. It is that the law subsequently changed.
The 2025 reconciliation law, Public Law 119-21, restricted eligibility for several programs included in CBO’s original projection. CBO’s newer 2026 Budget and Economic Outlook specifically identifies changes affecting Medicaid, SNAP, premium tax credits, and Medicare.
One of the largest changes begins October 1, 2026.
Under CMS guidance implementing section 71109, federal matching funds for full Medicaid and CHIP benefits generally become limited to U.S. citizens and nationals plus narrower noncitizen categories including lawful permanent residents, Cuban/Haitian entrants, and COFA migrants, subject to statutory exceptions.
CMS says that, beginning October 1, federal matching generally will no longer be available for full benefits solely on statuses such as refugee, asylee, parolee, or trafficking-victim status unless the person also fits another eligible category. Emergency Medicaid remains separate.
ACA premium subsidies are changing too. Beginning with 2027 coverage, CMS is limiting premium-tax-credit eligibility to statutorily defined eligible noncitizens.
That matters because the three categories most affected by these policy changes accounted for much of the original $177 billion estimate.
Put simply: $177 billion remains useful for understanding the 2024 baseline, but it should no longer be presented as what Washington is now expected to spend under current law.
The Population Changed Too
The law is not the only thing that changed. CBO’s assumptions about immigration changed dramatically as well.
In its 2026 demographic outlook, CBO estimates that net immigration in its “other foreign national” category fell to -360,000 in 2025. It projects another -330,000 in both 2026 and 2027.
That is very different from the surge trajectory behind the original 8.7-million-person estimate.
CBO attributes the revision primarily to administrative actions and, to a lesser extent, provisions of the 2025 reconciliation law. Future immigration remains uncertain, but the direction is important for this article: the population used to generate the old benefit projection is no longer developing as originally projected.
Spending Shifted to Enforcement
Benefit restrictions did not mean Washington stopped spending money on immigration. A large portion of the spending moved in another direction.
CBO estimates that the 2025 reconciliation law provided approximately $200 billion for border security and immigration enforcement. The money covers areas including border barriers, additional immigration agents and judges, detention capacity, and other enforcement activities.
This creates one of the most important contrasts in the entire cost story.
The old CBO baseline projected $177 billion in mandatory benefits over 11 years. Current law subsequently narrowed several of those benefit streams while authorizing roughly $200 billion of additional multi-year border and enforcement funding.
Those amounts cannot be compared as if they are equivalent. One is an old projection of benefit participation by a defined population and its children; the other is additional appropriated funding for government operations.
What the comparison does show is a significant change in the composition of federal immigration-related spending.
CBO says the new enforcement funding is expected to expand detention capacity and increase departures from the United States. Its demographic outlook estimates that roughly 100,000 additional detention beds could become available by 2028 under the law.
The Tax Side
A spending article becomes misleading if it stops before looking at revenue.
In exactly the same 2024 analysis that generated the $177 billion benefit figure, CBO projected that immigrants in the surge population would pay approximately $788 billion in federal income and payroll taxes from 2024 through 2034.
That included roughly $345 billion in individual income taxes and $443 billion in payroll taxes.
Compare the two direct figures:
$788 billion ÷ $177 billion = 4.45.
In the old CBO baseline, projected direct federal taxes from immigrants in the surge population were therefore about 4.45 times the mandatory benefit spending attributed to that population and its U.S.-born children.
That is not a complete cost-benefit ratio. The tax number excludes some broader revenue effects, while the spending side excludes discretionary appropriations and includes benefits for citizen children.
CBO’s broader economic model went further. It projected that the surge would increase total federal revenue by approximately $1.2 trillion and raise mandatory spending plus net interest by about $278 billion, reducing cumulative federal deficits by roughly $900 billion over 2024-2034 compared with CBO’s counterfactual.
Those figures carry the same caveat as the $177 billion number. They describe CBO’s 2024 model, not a fresh 2026 projection after subsequent policy and immigration changes.
Why States See Different Math
A federal fiscal gain and a local fiscal cost can exist at the same time.
That is because Washington collects much of the income and payroll tax revenue while cities and states pay heavily for schools, shelters, health services, policing, and other local programs.
CBO’s state and local analysis estimates that the immigration surge increased direct state and local expenditures by $19.3 billion in 2023.
The largest increases came from elementary and secondary education, shelter and related services, and border security.
CBO also estimates the surge generated approximately $10.1 billion in direct state and local tax revenue.
The calculation is straightforward:
$19.3 billion − $10.1 billion = $9.2 billion.
So CBO estimated a $9.2 billion direct net fiscal cost to state and local governments in 2023.
This is one of the most important findings in the entire debate. The old CBO analysis projected an improved federal fiscal balance from the surge while a later CBO analysis estimated a direct fiscal burden on states and localities.
The two findings do not contradict each other. They measure different levels of government receiving different revenues and paying different bills.
A Mixed-Status Family
A simple household example shows why attempts to calculate “the cost of an immigrant” quickly become unreliable.
Imagine a household containing a U.S.-born child, a lawful permanent resident parent, and another parent who lacks a qualifying immigration status.
Medicaid spending on the U.S.-born child is spending on a U.S. citizen. A qualifying tax credit claimed by the lawful permanent resident follows another set of eligibility rules. Emergency health services for the other parent fall under still another category.
If the federal government spends money investigating, detaining, adjudicating, or removing that parent, those are government immigration costs too, but they are not benefits paid to the household.
Lumping all four into “government benefits for undocumented immigrants” would erase the distinctions that determine the actual budget numbers.
Undocumented Immigrants
This is why there is no authoritative single federal total for spending specifically on undocumented immigrants.
People without qualifying immigration status generally cannot receive regular federally funded SNAP or full Medicaid on the same basis as eligible citizens and qualifying noncitizens. Emergency Medicaid and certain other programs work differently, and states can use their own money to provide services beyond federal eligibility.
Another complication is citizenship within families. Children born in the United States are U.S. citizens regardless of their parents’ immigration status. Government spending on those children is therefore not accurately described simply as spending on undocumented immigrants.
At the same time, excluding detention, courts, removal operations, border enforcement, and related administration would understate the government’s fiscal response to undocumented immigration.
Any national estimate that produces one clean number therefore depends heavily on what the researcher chooses to count.
Public Charge Rule
The 2026 public-charge rule adds another wrinkle because it can change spending even without directly changing every person’s statutory eligibility.
DHS’s final regulatory analysis estimates that the rule could produce approximately $7.71 billion per year in reduced federal transfer payments through disenrollment or forgone enrollment across Medicaid, CHIP, WIC, SNAP, TANF, SSI, and federal rental assistance.
DHS’s central estimate assumes a 10.3% disenrollment or forgone-enrollment response among the population it modeled.
The largest single component is Medicaid and CHIP. DHS estimates approximately $5.82 billion per year in reduced federal Medicaid and CHIP transfers. It separately estimates roughly $4.05 billion in reduced state Medicaid and CHIP transfers.
SNAP contributes approximately $1.02 billion of the estimated annual federal reduction.
Those are not guaranteed taxpayer savings. DHS describes them as estimated transfer reductions based on assumptions about household behavior. Its analysis also says the effect extends largely to enrollment decisions by people who are not themselves subject to the public-charge inadmissibility test.
That distinction is critical. The $7.71 billion should not be described simply as “$7.71 billion currently spent on immigrants.”
Rescission Proposal
A much smaller number generated substantial attention at the end of fiscal 2026.
On September 25, the White House submitted an $810 million rescission proposal covering 11 appropriation accounts.
The largest individual item was approximately $567.4 million from Refugee and Entrant Assistance.
That money should not be described as $567 million in cash payments to refugees. The account supports programs and services administered through HHS and other organizations.
The proposal also created a legal dispute because the affected budget authority was approaching expiration. On September 29, the Government Accountability Office concluded that the Impoundment Control Act does not permit the President to keep the proposed funds withheld past the end of fiscal 2026 unless Congress completes action rescinding them.
GAO explicitly stated that its conclusion concerned appropriations law rather than the merits of the programs themselves.
Costs Outside the Headline
Some of the most important public costs never appear in a table labeled “immigrant benefits.”
Schools may need teachers, classrooms, transportation, and English-language instruction. Municipalities may operate shelters. Hospitals may provide emergency or uncompensated care. Immigration courts require judges and staff. Detention requires facilities, medical care, transportation, security, and contractors. Border enforcement requires agents, vehicles, aircraft, surveillance technology, and infrastructure.
The reverse is also true. Cutting one federal benefit does not necessarily reduce total public spending dollar for dollar. Some costs can shift to a state, city, hospital, nonprofit, family, or another federal program.
That is why the older $37 billion FY2024 immigration-specific discretionary figure cannot capture every immigration-related public expense, and why the newer $200 billion enforcement appropriation should not be confused with annual spending.
For other examples of how federal budget headlines differ from their actual economic cost, see our analysis of the cost of a government shutdown per day and our breakdown of U.S. national debt by president.
So What Is the Answer?
If someone asks, “How much does the U.S. government spend on immigrants?” the most accurate short answer is:
There is no single current total.
The best-known CBO benchmark projected $177 billion in mandatory benefits over 2024-2034 for a defined surge population and its U.S.-born children, but that projection predates major eligibility restrictions and sharply lower subsequent immigration projections.
At the same time, the federal government is spending substantially more on enforcement. The 2025 reconciliation law provided about $200 billion in additional multi-year border and immigration-enforcement funding.
And any discussion of fiscal impact needs the revenue side: CBO’s older baseline projected $788 billion in direct federal taxes from the surge population, while its broader model projected an overall reduction in federal deficits.
At the state and local level, however, CBO estimated a $9.2 billion direct net cost in 2023.
Those figures are not competing answers. Together, they explain why one headline number cannot describe the fiscal effect of immigration.
What We Verified
We verified the original $177 billion figure against CBO’s July 2024 analysis. It covers the incremental immigration surge modeled by CBO and includes benefits used by people in that population and their U.S.-born children. It is not an estimate for all immigrants.
We verified the tax side from the same analysis. CBO projected $788 billion in income and payroll taxes from immigrants in the surge population and roughly $1.2 trillion in broader additional federal revenue.
We checked whether the $177 billion remains current. It does not function as a current-law forecast. The 2025 reconciliation law restricted eligibility for multiple benefit programs, and CBO’s 2026 demographic outlook projects dramatically lower net immigration in the relevant category.
We verified the October 1 Medicaid change directly through CMS. Federal matching for full Medicaid and CHIP benefits narrows substantially for noncitizens beginning October 1, 2026, subject to statutory exceptions.
We checked the public-charge cost estimates against DHS’s final rule rather than a lawsuit summary. DHS estimates approximately $7.71 billion in annual federal transfer reductions under its central behavioral assumption, including roughly $5.82 billion in federal Medicaid and CHIP transfers.
We verified the current rescission dispute using primary sources. The White House proposed $810 million in rescissions on September 25, and GAO issued its Impoundment Control Act conclusion on September 29.
Answers to Common Questions
How much does the federal government spend on immigrants?
No comprehensive current total exists. CBO’s best-known historical baseline projected $177 billion in mandatory benefits over 2024-2034 for a specific immigration-surge population and their U.S.-born children, but that estimate predates major 2025 eligibility changes.
Is the $177 billion figure annual?
No. It covers 11 fiscal years, from 2024 through 2034. A simple annual average would be about $16.1 billion, but actual projected spending varied by year.
Is $177 billion the current estimate?
No. It remains a useful baseline for understanding CBO’s 2024 analysis, but Congress later changed benefit eligibility and CBO later reduced its immigration projections.
What was the biggest part of the $177 billion?
ACA premium-tax-credit outlays were the largest category at roughly $59 billion. Other refundable tax credits contributed about $43 billion, and Medicaid and CHIP about $40 billion.
How much does the government spend on undocumented immigrants?
There is no authoritative single national figure. Federal benefit restrictions, emergency health care, state-funded programs, U.S.-citizen children, and enforcement spending all fall under different accounting and eligibility rules.
Disclosure: Educational content, not financial advice. Prices reflect public information as of the dates cited and can change. Confirm current rates, fees, taxes, and terms with official sources before purchasing. See our methodology and corrections policy.