
How Much Money Does Better Gas Mileage Save?
Published on | Written by Alec Pow
This article was researched using 17 sources. See our methodology and corrections policy.
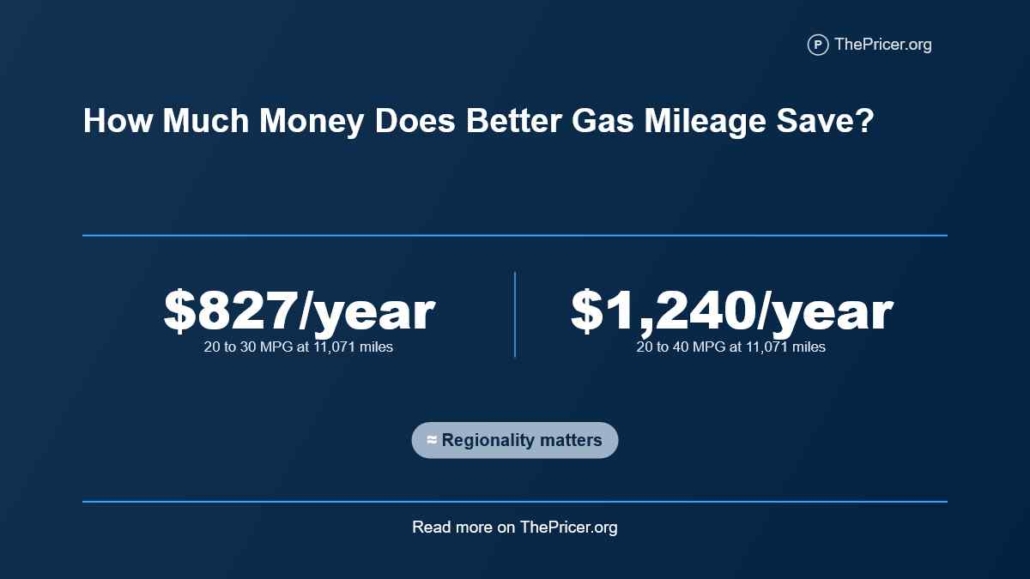
Better gas mileage can save a U.S. driver anywhere from under $200 to well above $1,000 per year, depending on the starting MPG, annual miles, and gasoline price. Using $4.48 per gallon, close to the national regular-gas average of $4.4768 on September 28, 2026, a driver traveling 11,071 miles saves about $827 per year by moving from 20 to 30 MPG. Moving from 20 to 40 MPG saves about $1,240 per year.
The timing makes that comparison more important for new-car buyers. On September 28, 2026, the U.S. Department of Transportation finalized new CAFE standards. The final NHTSA rule estimates required fleetwide CAFE levels of about 34.9 MPG for model year 2031, compared with about 49.3 MPG under the standards issued in 2024. DOT says the reset will reduce the average new-vehicle cost by $1,300. NHTSA also acknowledges that lower fuel-economy standards can mean higher gasoline spending over a vehicle’s life. The 34.9 and 49.3 MPG figures are regulatory fleet averages, not EPA window-sticker MPG for a specific car.
The starting MPG matters as much as the size of the improvement. A five-MPG gain from an inefficient vehicle can cut far more gallons than the same five-MPG gain from an already efficient car. That non-linear relationship is the key to calculating the real dollar value of better fuel economy.
Article Highlights
Jump to sections
- At 11,071 miles and $4.48 per gallon, 20 to 30 MPG saves about $827 (at $30 per hour, earning that amount would take about 3.4 full-time workdays, before taxes) per year.
- At the same mileage and fuel price, 20 to 40 MPG saves about $1,240 per year.
- A gain from 15 to 20 MPG saves about $827 per year, while 35 to 40 MPG saves only about $177.
- DOT says the new CAFE rule can reduce the average new-vehicle cost by $1,300. At today’s gas price, that amount equals roughly 1.7 to 5.5 years of fuel savings across the MPG comparisons modeled below.
- At 15,000 miles, a 25-to-40-MPG change saves about $1,008 per year.
- Fuel savings alone do not prove that buying a newer, higher-MPG vehicle costs less to own.
How Much Money Does Better Gas Mileage Save?
The table uses the FHWA’s 11,071-mile vehicle-use benchmark and a rounded national gasoline price of $4.48 per gallon. Every row holds mileage and fuel price constant, so the only variable changing is fuel economy.
| Fuel economy | Gallons per year | Annual fuel cost | Savings vs. 20 MPG |
|---|---|---|---|
| 15 MPG | 738.07 | $3,307 (about 2.8 full-time workweeks at $30 per hour) | -$827 |
| 20 MPG | 553.55 | $2,480 | $0 |
| 25 MPG | 442.84 | $1,984 | $496 |
| 30 MPG | 369.03 | $1,653 | $827 |
| 35 MPG | 316.31 | $1,417 | $1,063 |
| 40 MPG | 276.78 | $1,240 | $1,240 |
| 50 MPG | 221.42 | $992 | $1,488 |
The biggest percentage gains appear when an inefficient vehicle is replaced by one that uses far fewer gallons for the same trip. A 20-MPG vehicle costs about $22.40 per 100 miles at this gas price. A 30-MPG vehicle costs about $14.93, while a 40-MPG vehicle costs about $11.20.
A 50-MPG car trims the modeled fuel bill to about $992 per year, but the extra saving from 40 to 50 MPG is only about $248. That is a much smaller financial step than the earlier jump from 20 to 30 MPG, even though each change adds ten MPG.
How the Savings Math Works
The fuel-cost equation is simple. Divide annual miles by MPG to get gallons used, then multiply those gallons by the price of gasoline. The latest Federal Highway Administration highway statistics put 2024 vehicle use at 11,071 miles per vehicle. That gives a useful national mileage benchmark, though a commuter with a long drive can be far above it and a low-mileage household can be far below it.
At 20 MPG, 11,071 miles requires 553.55 gallons. At $4.48 per gallon, that fuel costs about $2,480 (about 2.1 full-time workweeks at $30 per hour) per year. At 30 MPG, the same distance requires 369.03 gallons and costs about $1,653. The difference is 184.52 gallons, worth about $827. The EPA uses the same basic relationship in its MPG wallet examples, where miles driven, MPG, and fuel price determine the annual bill.
Gas prices move quickly. The figures on this page use $4.48 as a dated national benchmark, not a promise about what fuel will cost through the next 12 months. Replacing it with your local pump price makes the calculation personal. The equation works the same way for any gasoline price.
Why Five MPG Can Mislead
MPG is not a linear measure of fuel consumption. The EPA explains the issue through gallons per 100 miles. A vehicle at 20 MPG burns 5 gallons per 100 miles. A 25-MPG vehicle burns 4 gallons. Moving from 20 to 25 MPG saves a full gallon every 100 miles. A 35-MPG vehicle uses about 2.86 gallons per 100 miles, while a 40-MPG vehicle uses 2.5 gallons, a difference of only about 0.36 gallon.
That difference becomes large over a year. At 11,071 miles and $4.48 per gallon, moving from 15 to 20 MPG saves about $827. Moving from 35 to 40 MPG saves only about $177. Both changes add five MPG, yet the lower-MPG vehicle saves about 4.7 times as much money.
This is the comparison many shopping discussions miss. A ten-MPG gain can be financially smaller than a five-MPG gain if the ten-MPG gain starts from a much higher efficiency level. Comparing gallons per 100 miles, or annual fuel cost, exposes the difference immediately and prevents the raw MPG change from overstating the value of a high-MPG upgrade.
Mileage Multiplies the Benefit
Annual mileage changes the dollar answer in direct proportion to distance driven. A move from 20 to 30 MPG saves about $597 per year at 8,000 miles, $827 at 11,071 miles, $1,120 at 15,000 miles, and $1,493 at 20,000 miles when gasoline is $4.48 per gallon. A high-mileage commuter gets far more value from the same MPG improvement than a household car that travels only a few thousand miles.
The EPA’s gasoline label uses 15,000 annual miles when estimating annual fuel cost. Its annual fuel-cost method also uses a projected fuel price. At that 15,000-mile distance and today’s $4.48 benchmark, 20 to 25 MPG saves $672, 20 to 30 MPG saves $1,120, and 30 to 40 MPG saves $560 each year.
This makes annual miles one of the first numbers a buyer should pull from odometer records. A vehicle advertised with a large MPG advantage may save less cash than expected when it is a second car driven 6,000 miles a year. The same vehicle can make a strong fuel-cost difference at 20,000 miles.
Driving Style Can Recover MPG
You do not always need another car to reduce fuel use. The Department of Energy’s Alternative Fuels Data Center reports that aggressive driving can reduce economy by 15% to 30% at highway speeds and 10% to 40% in stop-and-go traffic. Those ranges describe potential efficiency losses, not a guaranteed MPG gain available to every driver.
The money effect depends on the vehicle’s starting fuel use. A 25-MPG car driven 11,071 miles consumes about 443 gallons a year. If a change in driving habits cut fuel consumption by 10%, the modeled reduction would be about 44 gallons, worth roughly $198 per year at $4.48 per gallon. A 20% cut would be around 89 gallons and about $397. Those are illustrations built from the mileage and fuel-price assumptions, not measured savings for a particular driver.
Speed and idling matter too. DOE’s fuel-saving driving guidance says mileage drops rapidly at higher highway speeds and idling can burn roughly 0.25 to 0.5 gallon per hour. Cutting avoidable fuel use can create savings without taking on a loan, sales tax, or depreciation from replacing the vehicle.
Maintenance Gains
Basic maintenance can protect fuel economy, but the likely dollar gain is often smaller than changing from a low-MPG vehicle to a much more efficient one. The Department of Energy says properly inflated tires can improve gas mileage by about 0.6% on average and up to 3% in some cases. The same guidance cites an improvement of up to 2% from using the manufacturer’s recommended motor-oil grade.
At a modeled annual fuel bill of $1,984 for a 25-MPG vehicle, a 0.6% fuel reduction is worth about $12 per year. A 3% reduction is about $60. Those numbers help set expectations. Tire pressure has major safety and tire-life reasons beyond gasoline savings. NHTSA says proper tire inflation can save as much as 11 cents per gallon and can extend tire life.
A malfunction can be different. A fault that causes the engine to waste fuel can make repair economics very different from the small percentage gains tied to tire pressure or oil grade. That does not mean a repair should be purchased solely for fuel savings. Diagnosis, repair price, emissions performance, reliability, and safety all belong in that decision. Small maintenance gains and major mechanical faults are different cost cases.
Fuel Savings vs. Vehicle Price
The new CAFE rule puts an unusually clear number on the upfront side of this tradeoff. DOT says the reset can lower the average new-vehicle price by $1,300. That is an agency estimate across the market, not a guaranteed discount on a particular model. The rule itself also says lower fuel-economy standards can leave consumers spending more on gasoline over the life of their vehicles.
At 11,071 miles and $4.48 per gallon, a 35-MPG vehicle saves about $236 per year compared with a 30-MPG vehicle, so a $1,300 upfront difference would take about 5.5 years to recover through fuel alone. A 40-MPG vehicle saves about $413 per year versus 30 MPG, cutting that period to about 3.1 years. Comparing 25 MPG with 40 MPG produces about $744 per year in fuel savings, enough to equal $1,300 in about 1.7 years. These are buyer-level scenarios, not predictions of how the CAFE rule will change the MPG of any specific vehicle.
Better MPG can lower operating cost while still failing to repay a large purchase-price premium. At 11,071 miles and $4.48 per gallon, moving from 25 to 40 MPG saves about $744 per year in gasoline. If the more efficient vehicle costs an extra $2,000, fuel savings alone recover that premium in about 2.7 years. A $3,000 premium takes about 4.0 years. A $5,000 premium takes about 6.7 years.
At 15,000 miles, the same 25-to-40-MPG change saves about $1,008 per year, cutting the fuel-only recovery time on a $3,000 premium to about three years. This is why a buyer who drives more can justify paying extra for efficiency sooner. Consumer Reports’ current fuel-saving coverage also points to vehicle choice and driving habits as separate levers on the fuel bill.
Fuel is only one ownership line item. Depreciation, financing, insurance, repairs, taxes, and tires can be much larger. The broader annual car ownership cost can reverse a fuel-only comparison. The same warning applies when comparing gasoline with electricity, where EV ownership economics depend heavily on purchase price and charging source.
A Worked 22-to-32 MPG Case
Consider an illustrative driver covering 12,000 miles per year and paying $4.48 per gallon. At 22 MPG, the car uses about 545.45 gallons and costs roughly $2,444 per year to fuel. At 32 MPG, the same 12,000 miles uses 375 gallons and costs $1,680. The annual saving is about $764, or about $64 per month averaged across the year.
The calculation is 12,000 ÷ 22 × $4.48 for the old vehicle, minus 12,000 ÷ 32 × $4.48 for the more efficient vehicle. It assumes the same annual miles, the same gasoline price, and no change in fuel grade. It excludes purchase price, financing, insurance, maintenance, registration, depreciation, and taxes. Those exclusions matter if the 32-MPG result requires buying another car.
A hybrid can produce a large MPG jump, but the purchase still needs a full cost comparison. A model-specific page such as the Toyota Prius cost shows why vehicle price and ownership expenses need to sit beside fuel savings rather than being replaced by them. A low fuel bill can still accompany a higher total ownership bill.
When Better MPG Pays
Better fuel economy has the strongest cash effect when the old vehicle starts at low MPG, annual mileage is high, and the efficiency gain does not require a large price premium. It also becomes more valuable when gasoline is expensive. A driver moving from 20 to 30 MPG saves 184.52 gallons at 11,071 miles no matter what gas costs. At $3 per gallon, that is about $554. At $5 per gallon, it is about $923.
The choice gets weaker when the efficient vehicle costs thousands more and the buyer drives little. Keeping a reliable paid-off vehicle can cost less even when it burns more gasoline. Current pump prices also deserve context because the U.S. price has moved sharply during 2026, as tracked in the gas-price increase timeline. For the new CAFE debate, the useful buyer test is the same one: compare the actual price gap and EPA-rated MPG of the vehicles on your shortlist rather than treating a fleetwide regulatory average as the MPG of your next car.
Makes sense if
- You drive many miles each year.
- Your current vehicle has low MPG.
- The higher-MPG choice has a modest price premium.
- You expect to keep the vehicle beyond the fuel-savings recovery period.
Does not make sense if
- You drive very few annual miles.
- The replacement requires a large loan or price premium.
- The MPG gain starts from an already efficient vehicle.
- Depreciation, insurance, or financing erases the fuel saving.
What We Verified
We checked the live gasoline benchmark against EIA retail-price data, which showed U.S. regular at $4.478 per gallon for September 21, 2026. We confirmed the 11,071-mile 2024 vehicle-use figure separately in the FHWA VM-1 table.
We cross-referenced the non-linear MPG relationship against published MPG-cost research and checked the EPA’s latest vehicle-efficiency context in its Automotive Trends summary. The savings figures on this page are ThePricer calculations from the stated mileage, MPG, and fuel-price inputs rather than quoted savings estimates from those pages.
We also checked independent coverage of the final rule against the agency documents. The $1,300 figure is DOT’s projected average new-vehicle cost reduction, while the 34.9 MPG figure is a fleetwide CAFE estimate for model year 2031. Neither number describes a guaranteed discount or an EPA combined MPG rating for an individual vehicle.
Answers to Common Questions
How much does 5 MPG save per year?
It depends on the starting MPG. At 11,071 miles and $4.48 per gallon, 15 to 20 MPG saves about $827 per year, while 35 to 40 MPG saves about $177.
How much does 10 MPG save per year?
Starting at 20 MPG and moving to 30 MPG saves about $827 per year at 11,071 miles and $4.48 per gallon. Moving from 30 to 40 MPG saves about $413 under the same assumptions.
Is 30 MPG much cheaper than 20 MPG?
Yes for a driver covering substantial mileage. At 11,071 miles and $4.48 per gallon, 20 MPG costs about $2,480 per year in gasoline, while 30 MPG costs about $1,653, a difference near $827.
Can better gas mileage justify buying another car?
Sometimes. Divide the extra purchase price by the annual fuel saving to get a fuel-only recovery period, then compare that period with how long you expect to keep the car. Add financing, depreciation, insurance, taxes, maintenance, and repair differences before treating the fuel result as a full ownership answer.
Does the new CAFE rule mean every 2031 vehicle will get 34.9 MPG?
No. The 34.9 MPG figure is NHTSA’s estimated required fleetwide CAFE level for model year 2031. It is not an EPA combined MPG rating that every new car or truck must display. For a personal fuel-cost calculation, use the EPA MPG ratings of the specific vehicles you are comparing.
Disclosure: Educational content, not financial advice. Prices reflect public information as of the dates cited and can change. Confirm current rates, fees, taxes, and terms with official sources before purchasing. See our methodology and corrections policy.