
What is The Average U.S. Household Budget by Family Size?
Published on | Written by Alec Pow
This article was researched using 14 sources. See our methodology and corrections policy.
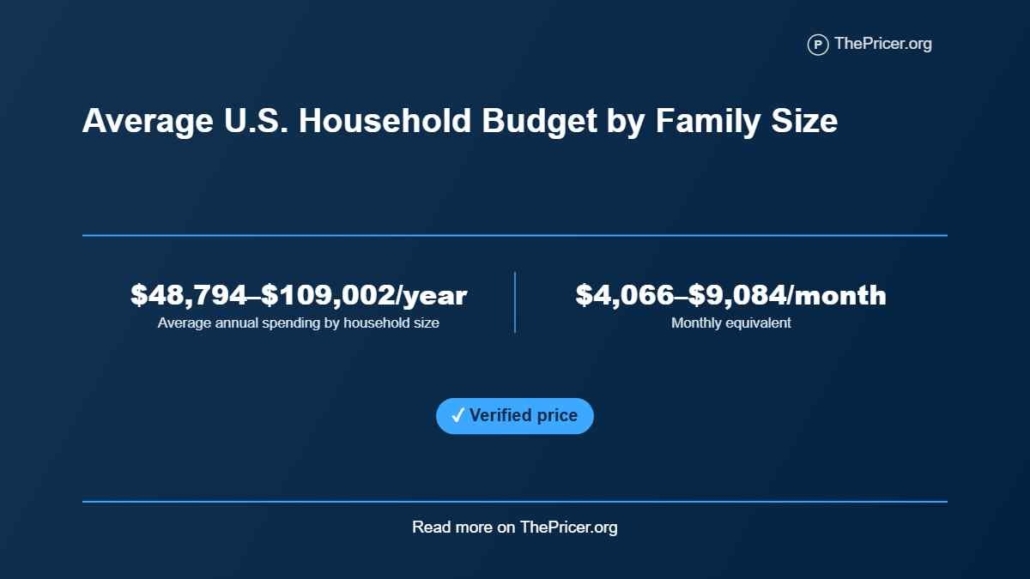
Average U.S. household spending in 2024 ranged from $48,794 per year for a one-person consumer unit to $109,002 per year for a four-person unit, while the five-or-more group averaged $103,472 per year. On a monthly basis, that works out to about $4,066 for one person, $6,736 for two, $7,684 for three, $9,084 for four, and $8,623 for five or more, according to the 2024 household-size expenditure table. These are observed expenditures rather than recommended spending targets, so they work best as national reference points.
The central entity is the U.S. consumer unit, the Bureau of Labor Statistics term for financially connected people who share major expenses. Household size, family composition, housing, transportation, food, healthcare, childcare, insurance, income, and geography all shape the budget. Headcount alone can miss large cost differences, especially when young children, paid care, high housing costs, or several vehicles change the household’s spending mix.
Article Highlights
Jump to sections
- A one-person consumer unit averaged $48,794 (at $30 per hour, earning that amount would take about 9.4 months of full-time work, before taxes) per year in 2024.
- A four-person unit averaged $109,002 per year, equal to about $9,084 per month.
- The five-or-more group averaged $103,472 per year, less than the four-person group.
- Housing, transportation, food, healthcare, entertainment, and personal insurance and pensions made up 89.3% of the four-person total.
- Per-person housing spending was 54.9% lower in the four-person group than in the one-person group.
Average Budget by Household Size
The Bureau of Labor Statistics publishes calendar-year spending by size of consumer unit. The one-person through five-or-more categories are grouped in the size-of-consumer-unit release, while the official BLS table cited above supplies the annual values. The monthly column is a simple conversion of annual spending divided by 12, so it is a budgeting reference rather than a separately reported BLS statistic.
| Consumer-unit size | Average annual spending | Monthly equivalent | Annual spending per person |
|---|---|---|---|
| 1 person | $48,794 (about 9.4 months of full-time work at $30 per hour) | $4,066 | $48,794 |
| 2 people | $80,830 | $6,736 | $40,415 |
| 3 people | $92,205 | $7,684 | $30,735 |
| 4 people | $109,002 | $9,084 | $27,251 |
| 5 or more | $103,472 | $8,623 | Not a fixed five-person denominator |
The table shows why a household-size average cannot be read as a fixed price for each additional person. Spending rises by $32,036 from one to two people, by another $11,375 from two to three, and by $16,797 from three to four. The five-or-more category then falls by $5,530 against the four-person average. Those gaps describe different survey groups with different incomes and household structures. They do not measure the cost of adding a spouse, child, parent, or roommate to the same home.
What the Average Measures
BLS uses the term consumer unit rather than family. A consumer unit can be one financially independent person, related people in one household, or unrelated people who pool income and make joint spending decisions. The official BLS definition ties a consumer unit to financial independence or shared major expenses, so two people sharing an address do not automatically form one unit for this survey. The measure follows joint finances, not only the number of people under one roof.
The published expenditure mean is also not a target that BLS says households should follow. BLS explains that its primary statistic is a weighted average per consumer unit, with survey weights used to represent similar units in the U.S. civilian noninstitutional population. The published weighted-average calculation method also describes adjustments for taxes on purchases, reimbursements, business expenses, and missing data. That makes the figures useful for comparison, but a household should not force its rent, mortgage, childcare, or retirement contributions to match a national mean.
Headcount is only the starting point.
A two-adult household with no children, a single parent with two children, and three unrelated adults can all have three people yet face very different bills. Housing tenure, number of earners, vehicles, healthcare coverage, and child ages can change both the spending level and the mix. The family-size table answers how much groups spent on average. It does not answer how much a given household must earn or what a basic-needs budget should be.
Where a Four-Person Budget Goes
A four-person consumer unit provides a useful worked example because its 2024 total was $109,002 (about 1.7 years of full-time work at $30 per hour) per year, or $9,083.50 per month. The underlying table reports four-person housing spending at $34,389, transportation at $19,527, personal insurance and pensions at $16,252, food at $14,543, including food at home at $8,697, healthcare at $7,629, and entertainment at $4,995 for the year.
Converted to monthly amounts, that is $2,865.75 for housing, $1,627.25 for transportation, $1,354.33 for personal insurance and pensions, $1,211.92 for food, $635.75 for healthcare, and $416.25 for entertainment. Those six categories add to $97,335 per year, or $8,111.25 per month. Dividing $97,335 by the full $109,002 total shows that they account for 89.3% of spending.
The remaining BLS categories add to $11,667 per year, equal to $972.25 per month. That remainder includes items such as apparel, education, personal care, cash contributions, miscellaneous spending, and other published categories. It should not be labeled spare or discretionary money. A family can also have large costs that are low or absent for another household, so a line-by-line personal budget can depart from this national mix even when its total spending is close.
How Costs Scale
The size table hides a strong economy-of-scale effect. The corresponding table puts one-person housing spending at $19,052, while the four-person input above is $34,389. Dividing the four-person housing figure by four gives $8,597.25 per person, 54.9% below the one-person amount. Four-person total spending is $27,250.50 per person, 44.2% below the one-person total of $48,794. Healthcare is 52.6% lower per person, utilities 48.1% lower, entertainment 42.9% lower, food 35.6% lower, and transportation 29.8% lower.
Those percentages are comparisons between separate survey groups. They do not prove that a one-person household will cut its own per-person costs by a set percentage after adding people. Shared shelter, appliances, internet service, and many household goods can serve several people without multiplying at the same rate as headcount. Other expenses, such as vehicles, food, or employment-linked contributions, can grow more directly with additional adults and children.
The five-or-more category reinforces that warning. BLS-linked characteristics show that this group averaged 5.7 people, 2.7 children under 18, 2.4 earners, and $138,279 in income before taxes in 2024. The published characteristics show a 5.7-person average, which explains why the category is not an exact five-person budget. The lower spending total cannot be used to claim that a fifth person reduces household costs.
Children Change the Budget
Family size becomes less informative when children enter the comparison because age and care arrangements can reshape the bill. Child Care Aware of America reported a 2025 national average annual child-care price of $13,184 across its methods and available state data. Its 2025 report also compares child-care price differences across infant, preschool, center-based, and family-home care. That single national figure is not the expected tuition for every child or city.
For scale, $13,184 equals about 12.1% of the BLS four-person annual spending benchmark of $109,002. That comparison is informative, but adding the two figures would be wrong. Paid child care is not universal, and the BLS figure is already a total of observed household expenditures rather than a base amount designed for extra charges to be stacked on top. A family with a stay-at-home parent may have no paid care line, while a two-earner family with two young children can face a much larger amount.
Child age matters beyond care. Food, clothing, transportation, activities, healthcare, and education can shift as children grow. Families planning for the longer arc can compare those components with a separate child-rearing cost guide. Families pricing a private early-education provider can also use a current Primrose tuition comparison instead of treating a national child-care mean as a local quote.
Food Costs
BLS measures what households reported spending, while USDA Food Plans estimate food-at-home costs under defined household assumptions. Those are different questions. In the four-person BLS data above, food at home was $8,697 per year, or $724.75 per month. USDA’s July 2026 Thrifty Food Plan lists a reference family of two adults ages 20 through 50 and two children ages 6 through 8 and 9 through 11 at $1,024.90 per month. The plan covers food prepared at home, including food and beverages purchased for home preparation.
The gap between $724.75 and $1,024.90 should not be read as a finding that the BLS household underbought food or that USDA families must spend more. The BLS number is an observed mean for every four-person consumer unit in its sample group. The USDA number uses a defined reference family and a nutrition-plan model. Age mix, food away from home, location, dietary choices, and survey methodology differ.
USDA’s size adjustment is useful for personal planning because food does not scale perfectly per person. Smaller households lose some purchasing and preparation efficiencies, while larger households can spread package sizes and ingredients across more people. A grocery benchmark should match the ages and household size being fed, then sit beside actual restaurant and takeout spending rather than being mixed with it.
Location Can Rewrite the Budget
 A national household average can hide large local differences in shelter and other basic needs. The MIT Living Wage Calculator’s February 2026 data for a two-adult, both-working household with one child put annual housing at $16,959 in the State College, Pennsylvania metro. The same family type had housing of $27,033 in the Sacramento-Roseville-Folsom, California metro. The calculator lists the State College amount for that family type and lists the Sacramento amount under the same family structure.
The difference is $10,074 per year, or $839.50 per month, for housing in that matched family type. This is a calculated location gap, not a rent quote. MIT’s model is designed around basic needs and uses local inputs, while the BLS figures describe observed spending. Putting the two systems side by side shows why a national average can be a poor ceiling or floor for a specific city.
After shelter, replace utilities, transportation, insurance, and childcare with local quotes or actual bills rather than national estimates. A household replacing national estimates should start with shelter and paid care because those large lines can move a personal total far from the national figure. A separate monthly utility cost guide can help isolate that part of the housing-related bill.
Turn the Average Into Your Budget
The safest use of a national spending average is as a comparison point, not a spending command. Start with the row closest to your household size, then replace the largest categories with numbers you already know. Housing should use your rent or full ownership cost. Transportation should reflect vehicle payments, fuel, insurance, repairs, parking, and transit. Food should separate groceries from meals away from home. Healthcare should include premiums and expected out-of-pocket costs.
Then handle costs that depend on household composition. Paid childcare belongs only where it applies. Retirement contributions and personal insurance can move with employment and benefits. Education, elder care, disability-related expenses, debt payments, and savings goals may make a personal plan look nothing like the survey mean. That is a major distinction. The BLS average describes spending that happened. A personal budget allocates money before it is spent.
Makes sense if
- You want a national reference for a similarly sized household.
- You need an annual figure converted to a monthly planning number.
- You want to spot categories far above or below a national peer group.
- You will replace national amounts with known local bills.
Does not make sense if
- You treat the average as a required spending level.
- You read the five-plus row as an exact five-person household.
- You use group differences as the cost of adding one child or adult.
- You need a local basic-needs or living-wage calculation.
Answers to Common Questions
What is the average monthly budget for one person?
The 2024 BLS size table works out to about $4,066 per month from annual average spending of $48,794. It is an observed national mean, not a recommended minimum.
What is the average monthly budget for a family of four?
A four-person consumer unit averaged $109,002 per year in 2024, equal to about $9,084 per month. Household composition, city, childcare use, and income can move a real family’s spending far from that figure.
Why does the five-plus group spend less than four people?
The groups contain different households. The five-plus category averaged 5.7 people and had its own mix of children, earners, income, and housing. The lower mean does not imply that adding another person reduces the same family’s costs.
Should I use BLS or USDA for a grocery budget?
Use BLS to compare observed household spending and USDA Food Plans to build a food-at-home benchmark for a defined family. They measure different things, so a direct dollar comparison needs that qualification.
Disclosure: Educational content, not financial advice. Prices reflect public information as of the dates cited and can change. Confirm current rates, fees, taxes, and terms with official sources before purchasing. See our methodology and corrections policy.